Cisco Observability Platform is designed to ingest and process vast amounts of MELT (Metrics, Events, Logs and Traces) data. It is built on top of open standards like OpenTelemetry to ensure interoperability.
What sets it apart is its provision of extensions, empowering our partners and customers to tailor every facet of its functionality to their unique needs. Our focus today is unveiling the intricacies of customizations specifically tailored for data processing. It is expected that you have an understanding of the platform basics, like Flexible Metadata Model (FMM) and solution development. Let’s dive in!
Understanding Data Processing Stages
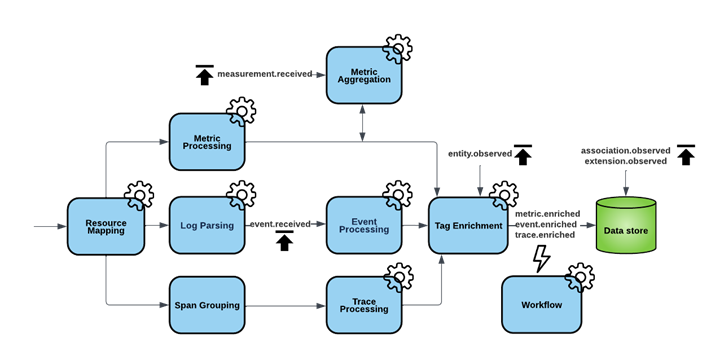
The data processing pipeline has various stages that lead to data storage. As MELT data moves through the pipeline, it is processed, transformed, and enriched, and eventually lands in the data store where it can be queried with Unified Query Language (UQL):

Each stage marked with a gear icon allows customization of specific logic. Furthermore, the platform enables the creation of entirely custom post-processing logic when data can no longer be altered.
To streamline customization while maintaining flexibility, we are embracing a new approach: workflows, taps, and plugins, utilizing the CNCF Serverless Workflow specification with JSONata as the default expression language. Since Serverless Workflows are designed using open standards, we are extensively utilizing CloudEvents and OpenAPI specifications. By leveraging these open standards, we ensure compatibility and ease of development.
Data processing stages that allow data mutation are called taps, and their customizations plugins. Each tap declares an input and output JSON schema for its plugins. Plugins are expected to produce an output that adheres to the tap’s output schema. A tap is responsible for merging outputs from all its plugins and producing a new event, which is a modified version of an original event. Taps can only be authored by the platform, while plugins can be created by any solution as well as regular users of the platform.
Workflows are meant for post-processing and thus can only subscribe to triggers (see below). Workflow use cases range from simple event counting to sophisticated machine learning model inferences. Anyone can author workflows.
This abstraction allows developers to reason in terms of a single event, without exposing the complexity of the underlying stream processing, and use familiar well documented standards, both of which lower the barrier of entry.
Events as a connecting tissue
Each data processing stage communicates with other stages via events, which allows us to decouple consumers and producers and seamlessly rearrange the stages should the need arise.
Each event has an associated category, which determines whether a specific stage can subscribe to or publish that event. There are two public categories for data-related events:
- data:observation – a category of events with publish-only permissions which can be thought of as side-effects of processing the original event, for example, an entity derived from resource attributes in OpenTelemetry metric packet. Observations are indicated with upward ‘publish’ arrows in the above diagram. Taps, workflows and plugins can all produce observations. Observations can only be subscribed to by specific taps.
- data:trigger – subscribe-only events that are emitted after all the mutations have completed. Triggers are indicated with a lightning ‘trigger’ icon in the above diagram. Only workflows (post-processing logic) can subscribe to triggers, and only specific taps can publish them.
There are five observation event types in the platform:
- entity.observed – FMM entity was discovered while processing some data. It can be a new entity or an update to an existing entity. Each update from the same source fully replaces the previous one.
- association.observed – FMM association was discovered while processing some data. Depending on the cardinality of the association the update logic differs
- extension.observed – FMM extension attributes were discovered while processing some data. A target entity must already exist.
- measurement.received – a measurement event which contributes to a specific FMM metric. These measurements will be aggregated into a metric in Metric aggregation tap. Aggregation logic depends on the metric’s content type.
- event.received – raises a new FMM event. This event will also be processed by the Event processing tap, just like externally ingested events.
There are 3 trigger event types in the platform, one for each data kind: metric.enriched, event.enriched, trace.encriched. All three events are emitted from the final ‘Tag enrichment’ tap.
Each event is registered in a platform’s knowledge store, so that they are easily discoverable. To list all available events, simply use fsoc to query them, i.e., to get all triggers:
fsoc knowledge get --type=contracts:cloudevent --filter="data.category eq 'data:trigger'" --layer-type=TENANT
Note that all event types are versioned to allow for evolution and are qualified with platform solution identifier for isolation. For example, a fully qualified id of measurement.received event is platform:measurement.received.v1
Authoring Workflows: A Practical Example
Let’s illustrate the above concepts with a straightforward example. Consider a workflow designed to count health rule violations for Kubernetes workloads and APM services. The logic of the workflow can be broken down into several steps:
- Subscribe to the trigger event
- Validate event type and entity relevance
- Publish a measurement event counting violations while retaining severity
Development Tools
Developers can utilize various tools to aid in workflow development, such as web-based editors or IDEs.
- web-based editor
- VS Code with Kogito editor or default extension
- any IDE that integrates with org, i.e. Intellij IDEA
It’s crucial to ensure expressions and logic are valid through unit tests and validation against defined schemas.
To aid in that, you can write unit tests by utilizing stated, see an example for this workflow.
Online JSONata editor can also be a helpful tool in writing your expressions.
A blog on workflow testing is coming soon!
Step by Step Guide
Create the workflow DSL
Provide a unique identifier and a name for your workflow:
id: violations-counter
version: '1.0.0'
specVersion: '0.8'
name: Violations Counter
Find the trigger event
Let’s query our trigger using fsoc:
fsoc knowledge get --type=contracts:cloudevent --object-id=platform:event.enriched.v1 --layer-type=TENANT
Output:
type: event.enriched.v1
description: Indicates that an event was enriched with topology tags
dataschema: contracts:jsonSchema/platform:event.v1
category: data:trigger
extensions:
  - contracts:cloudeventExtension/platform:entitytypes
  - contracts:cloudeventExtension/platform:source
Subscribe to the event
To subscribe to this event, you need to add an event definition and event state referencing this definition (note a nature of the reference to the event – it must be qualified with its knowledge type):
events:
  - name: EventReceived
    type: contracts:cloudevent/platform:event.enriched.v1
    kind: consumed
    dataOnly: false
    source: platform
states:
  - name: event-received
    type: event
    onEvents:
      - eventRefs:
          - EventReceived
Inspect the event
Since the data in workflows is received in JSON format, event data is described in JSON schema.
Let’s look at the JSON schema of this event (referenced in dataschema), so you know what to expect in our workflow:
fsoc knowledge get --type=contracts:jsonSchema --object-id=platform:event.v1 --layer-type=TENANT

Result:
$schema: http://json-schema.org/draft-07/schema#
title: Event
$id: event.v1
type: object
required:
  - entities
  - type
  - timestamp
properties:
  entities:
    type: array
    minItems: 1
    items:
      $ref: '#/definitions/EntityReference'
  type:
    $ref: '#/definitions/TypeReference'
  timestamp:
    type: integer
    description: The timestamp in milliseconds
  spanId:
    type: string
    description: Span id
  traceId:
    type: string
    description: Trace id
  raw:
    type: string
    description: The raw body of the event record
  attributes:
    $ref: '#/definitions/Attributes'
  tags:
    $ref: '#/definitions/Tags'
additionalProperties: false
definitions:
  Tags:
    type: object
    propertyNames:
      minLength: 1
      maxLength: 256
    additionalProperties:
      type: string
  Attributes:
    type: object
    propertyNames:
      minLength: 1
      maxLength: 256
    additionalProperties:
      type:
        - string
        - number
        - boolean
        - object
        - array
  EntityReference:
    type: object
    required:
      - id
      - type
    properties:
      id:
        type: string
      type:
        $ref: '#/definitions/TypeReference'
      additionalProperties: false
  TypeReference:
    type: string
    description: A fully qualified FMM type reference
    example: k8s:pod
It’s straightforward – a single event, with one or more entity references. Since dataOnly=false, the payload of the event will be enclosed in the data field, and extension attributes will also be available to the workflow.
Since we know the exact FMM event type we are interested in, you can also query its definition to understand the attributes that the workflow will be receiving and their semantics:
fsoc knowledge get --type=fmm:event --filter="data.name eq \"healthrule.violation\" and data.namespace.name eq \"alerting\"" --layer-type=TENANT
Validate event relevance
You’ll need to ensure that the event you receive is of the correct FMM event type, and that referenced entities are relevant. To do this, you can write an expression in JSONata and then use it in an action condition:
functions:
  - name: checkType
    type: expression
    operation: |-
      data.type = 'alerting:healthrule.violation' and (
          'k8s:deployment' in data.entities.type or
          'k8s:statefulset' in data.entities.type or
          'k8s:daemonset' in data.entities.type or
          'k8s:cronjob' in data.entities.type or
          'k8s:managed_job' in data.entities.type or
          'apm:service' in data.entities.type
      )
 states:
  - name: event-received
    type: event
    onEvents:
      - eventRefs:
          - EventReceived
        actions:
          - name: createMeasurement
            condition: ${ fn:checkType }
Create and publish an event
Let’s find the measurement observation event that you need to publish:
fsoc knowledge get --type=contracts:cloudevent --object-id=platform:measurement.received.v1 --layer-type=TENANT
Output:
type: measurement.received.v1
description: Indicates that measurements were received. Measurements are then aggregated into a metric.
dataschema: contracts:jsonSchema/platform:measurement.v1
category: data:observation
extensions:
  - contracts:cloudeventExtension/platform:source
Now let’s look at the measurement schema so you know how to produce a measurement event:
fsoc knowledge get --type=contracts:jsonSchema --object-id=platform:measurement.v1 --layer-type=TENANT
Output:
$schema: http://json-schema.org/draft-07/schema#
title: Measurements for a specific metric
$id: measurement.v1
type: object
required:
  - entity
  - type
  - measurements
properties:
  entity:
    $ref: '#/definitions/EntityReference'
  type:
    $ref: '#/definitions/TypeReference'
  attributes:
    $ref: '#/definitions/Attributes'
  measurements:
    type: array
    minItems: 1
    description: Measurement values with timestamp to be used for metric computation
    items:
      type: object
      required:
        - timestamp
      oneOf:
        - required:
            - intValue
        - required:
            - doubleValue
      properties:
        timestamp:
          type: integer
          description: The timestamp in milliseconds
        intValue:
          type: integer
          description: Long value to be used for metric computation.
        doubleValue:
          type: number
          description: Double Measurement value to be used for metric computation.
      additionalProperties: false
additionalProperties: false
definitions:
  Attributes:
    type: object
    propertyNames:
      minLength: 1
      maxLength: 256
    additionalProperties:
      type:
        - string
        - number
        - boolean
  EntityReference:
    type: object
    required:
      - id
      - type
    properties:
      id:
        type: string
      type:
        $ref: '#/definitions/TypeReference'
      additionalProperties: false
  TypeReference:
    type: string
    description: A fully qualified FMM type name
    example: k8s:pod
Create a measurement
Let’s create another expression that takes the input event and generates a measurement as per the above schema, and use it in an action in the event state:
functions:
  ...
  - name: createMeasurement
    type: expression
    operation: |-
      {
          'entity': data.entities[0],
          'type': 'sampleworkflow:healthrule.violation.count',
          'attributes': {
              'violation_severity': data.attributes.violation_severity
          },
          'measurements': [
              {
                  'timestamp': data.timestamp,
                  'intValue':
$exists(data.attributes.'event_details.condition_details.violation_count')? data.attributes.'event_details.condition_details.violation_count': 1
              }
          ]
      }
states:
  - name: event-received
    type: event
    onEvents:
      - eventRefs:
          - EventReceived
        actions:
          - name: createMeasurement
            condition: '${ fn:checkType }'
            functionRef: createMeasurement
            actionDataFilter:
              toStateData: '${ measurement }'
Here we are preserving the violation_severity attribute from the original event and associating the measurement with the same entity.
The state execution will result in a measurement field created by createMeasurement action, but only if the event was interesting based on the condition.
Note that since we are using a new FMM metric type – sampleworkflow:healthrule.violation.count – we need to register it via the extension on the target entity types. See full solution linked below for details.
Publish an event
The next step is to check if the measurement was indeed created, and produce an event if it was. To do that, we will use a switch state:
states:
  - name: event-received
    type: event
    onEvents:
      - eventRefs:
          - EventReceived
        actions:
          - name: createMeasurement
            condition: ${ fn:checkType }
            functionRef:
              refName: createMeasurement
            actionDataFilter:
              toStateData: ${ measurement }
    transition: check-measurement
  - name: check-measurement
    type: switch
    dataConditions:
      - condition: ${ measurement != null }
        end:
          terminate: true
          produceEvents:
            - eventRef: CreateMeasurement
              data: ${ measurement }
    defaultCondition:
      end: true
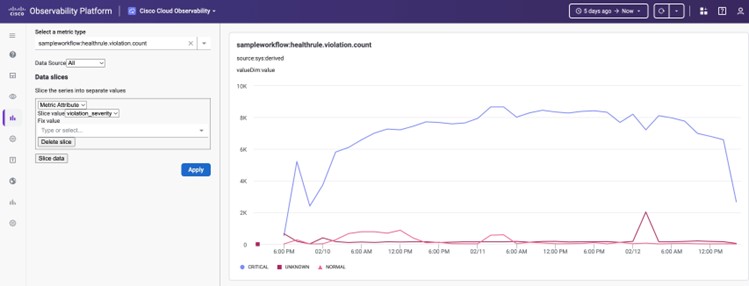
That’s it! You can package your workflow in a solution, push your solution, subscribe to it, and view the metrics by navigating to the metric explorer at https://<your tenant>.observe.appdynamics.com/explore/cco/metric-explorer
An example graph sliced by violation_severity

Conclusion and Next Steps
In conclusion, the extensibility of the Cisco Observability Platform empowers developers to tailor data processing to their specific requirements efficiently. Whether it’s customizing processing logic or implementing complex workflows, the platform provides the necessary tools and flexibility.
Ready to learn more? Visit examples repo to explore further and start customizing your data processing workflows today.


