
This is the third of a series of blogs dedicated to explaining how to use ACI Micro Segmentation capabilities. In the first blog we described how to use ACI micro segmentation to implement a 2-tier web application using Apache Web servers and a MySQL database. In the second blog we illustrated how to leverage the APIC API to dynamically create a sandboxed environment for Development and Testing, and how to leverage VM-attribute based micro segmentation to easily transition workloads from Dev to Test to Production environments including L4-7 services automation.
In this post, we will look at the advantages of implementing micro segmentation in Cisco ACI from an operations point of view. We will be concerned with how to view the impact of physical network failures, evaluate the status of the application from a network standpoint and how to troubleshoot connectivity problems.
We will do so with a demo, working on the dev/test/prod environment from the previous blog post. If you want to skip the blog and go to the demo you can do that too. A quick reminder of the environment is shown on the picture below:
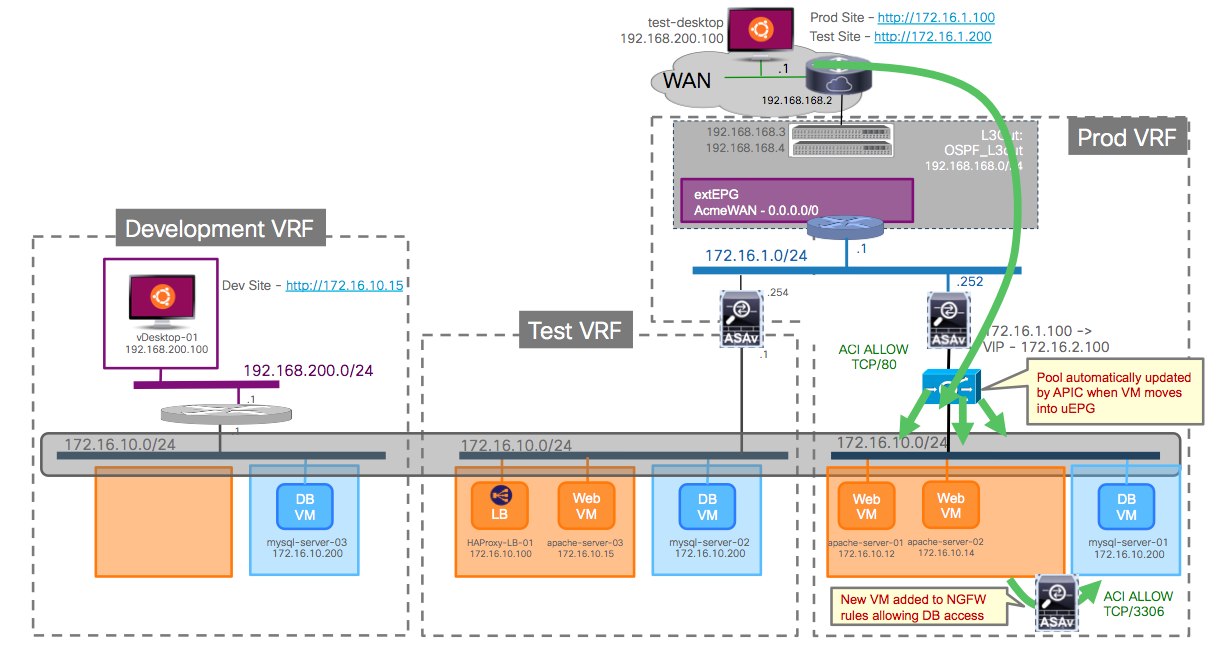
We can see the three VRFs (Dev, Test and Prod) and uEPGs for Web and DB on each of the environments. Virtual Machines connect always to the same dvPortGroup, and depending on their attributes they will be placed on the right uEPG.
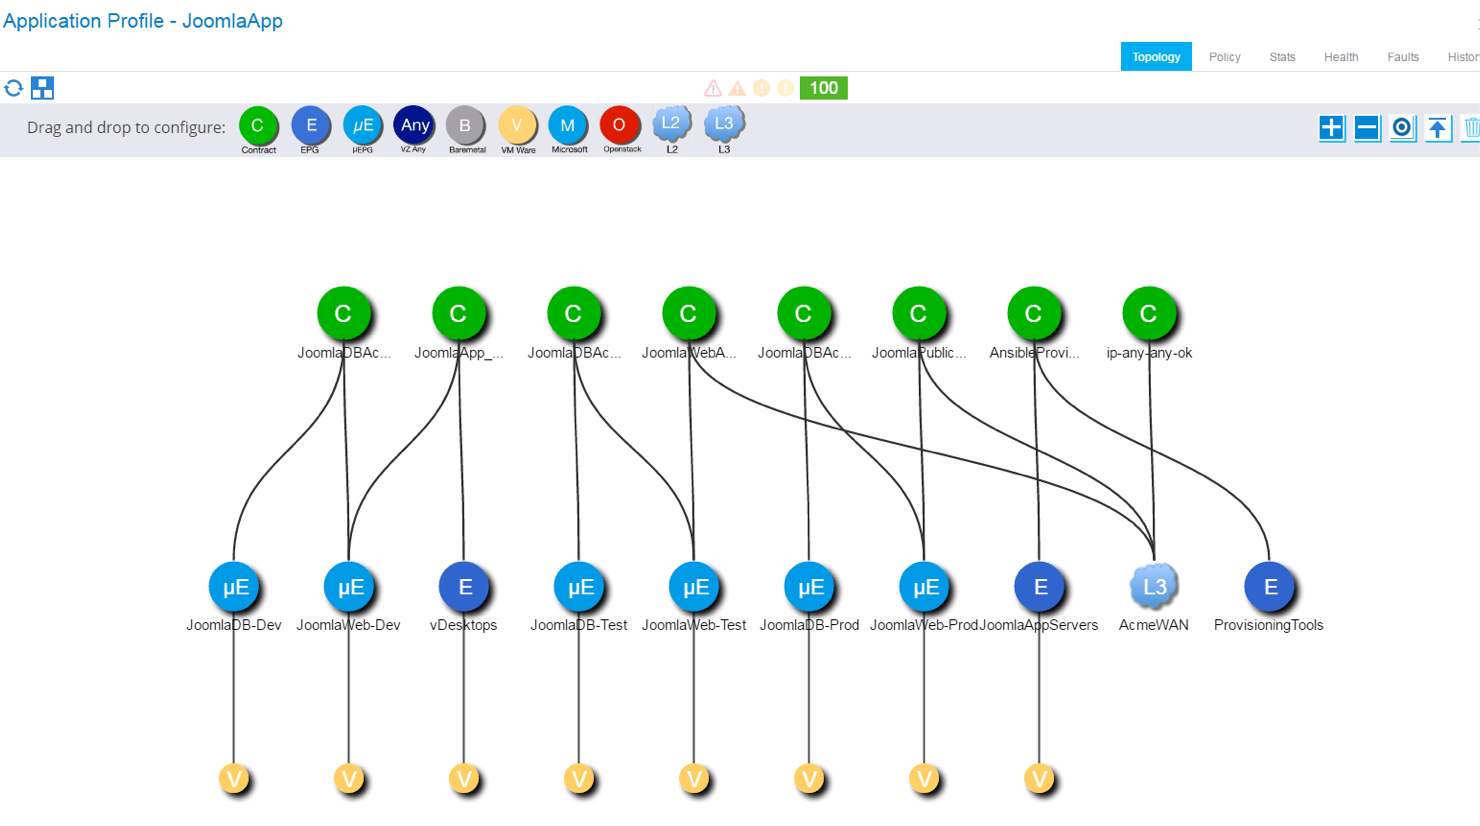
This environment is seen in the APIC GUI in the following Application Profile, showing the various uEPG used for Dev, Test and Prod environments along with the contracts that establish relations between them, and with external networks (via the L3Out and external EPG AcmeWAN).
Now it is also time we look at the physical topology of the lab we used to build these demos:
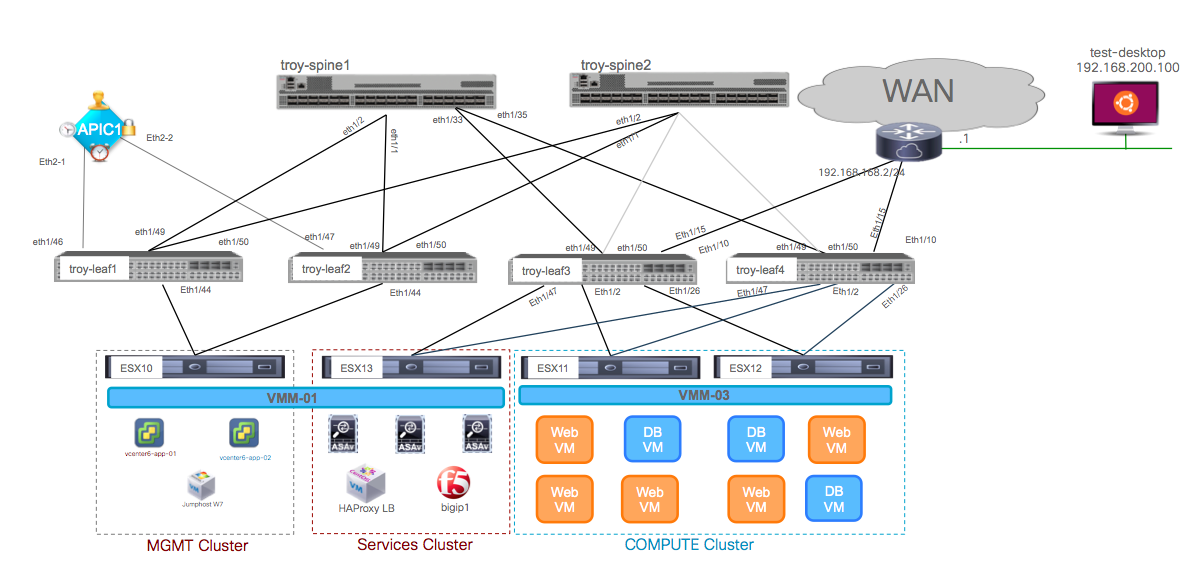
It is a very simple environment where I have a vSphere DRS cluster of two servers (ESX11 and ESX12) where all user Virtual Machines are running. Then there is a “cluster” of one server (ESX13) where I am deploying all virtual services (ASAv, BigIP-VE, HAProxy …) and finally there’s connectivity between two of the leafs that are acting as border leafs (troy-leaf3 and troy-leaf4) and a WAN router to simulate the Acme WAN/Internet access.
Application Visibility and Impact Assessment
One of the advantages of ACI is that network virtualisation (i.e. network overlays) is integrated with the underlay fabric and under a single policy and management controller, the APIC. Therefore, when any endpoint, be it virtual or physical, attaches to the fabric it does so by connecting to virtual networks that are created for the applications that run on that endpoint (via Application Profiles). The fabric has visibility at all moments of where those endpoints are running (where they are connected), and in addition it also has a context of what application, application tier and tenant they are part of and to whom they can communicate with.
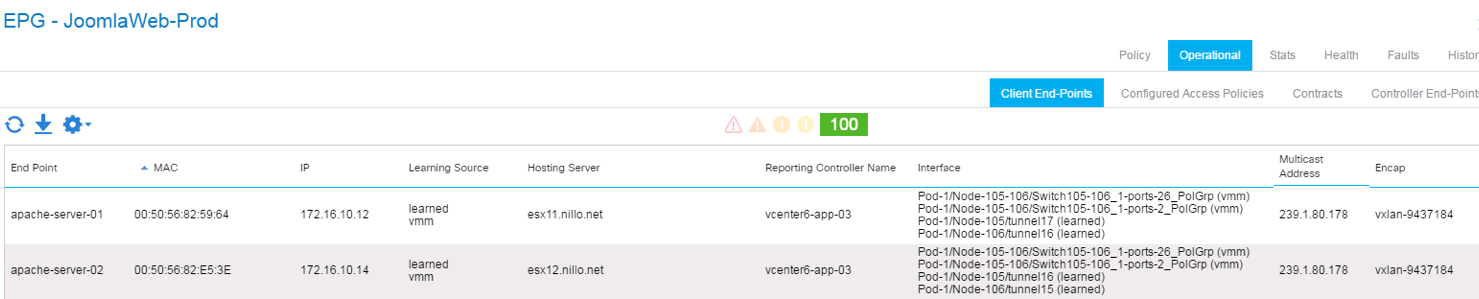
For instance, if we look at the endpoints inside the JoomlaWeb-Prod uEPG, we can see the endpoints in there, including the VM name, the physical hosts on which they are running, the vCenter that manages those hosts and the vPC and VXLAN details we are using to connect that host and the endpoint to the fabric. For instance, below we see that the vPC using port 1/26 on nodes 105 and 106 (troy-leaf 3 and troy-leaf 4) is used for connectivity to endpoints part of the JoomlaWeb-Prod uEPG:
And this is true in both ways. We can also go the other way around and find a specific port and see what applications are running behind it. If the fabric administrator would try to disable one of those ports, say port 1/26 on troy-leaf3, it would get a warning telling it not only the network protocols running on that port, but also the applications and tenants impacted as you can see below:
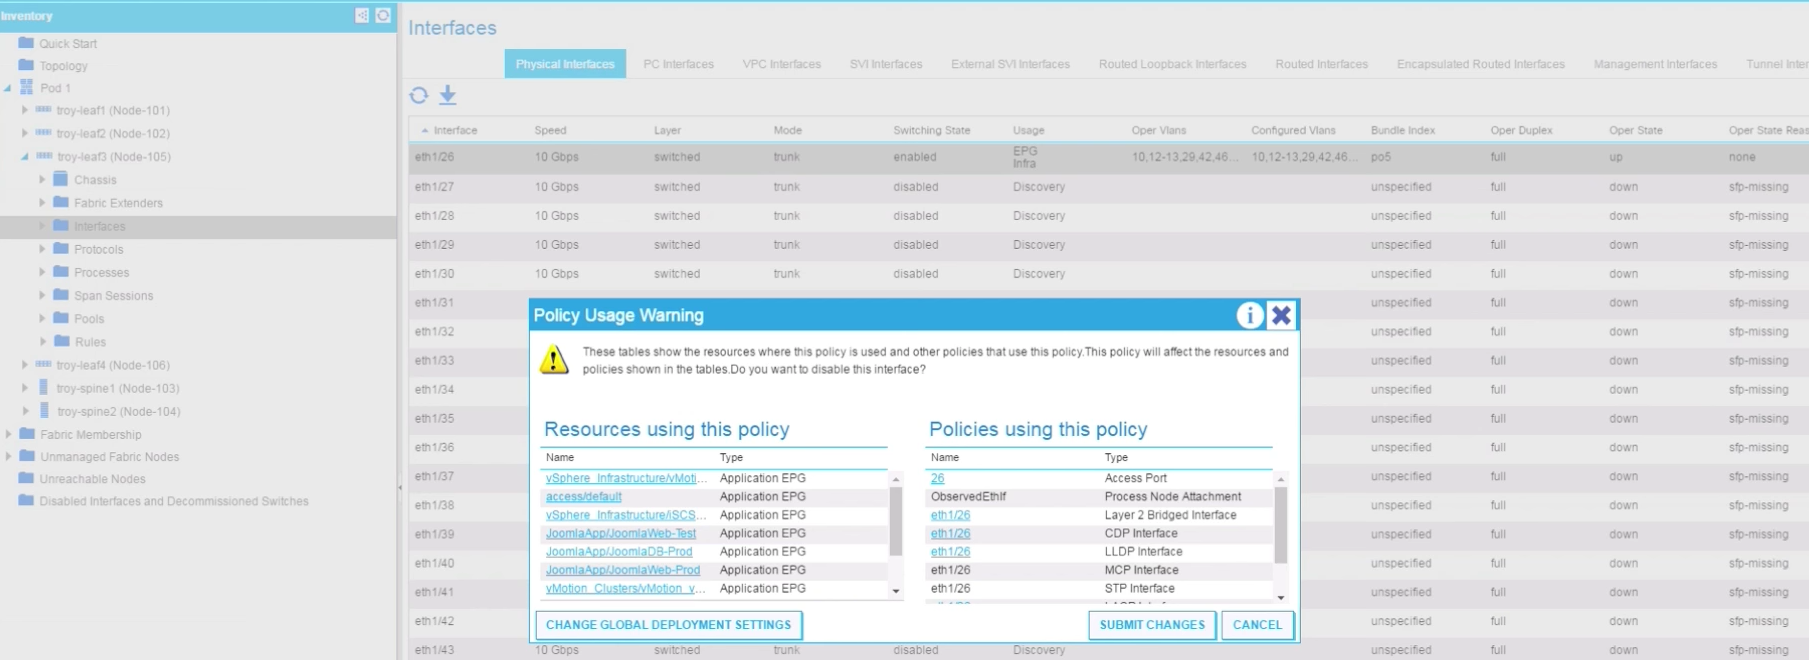
This is very interesting because it provides a simple, effective and easy way to assess the impact on actual applications ahead of any network changes.
Also, this information is automatically updated and always on-synch, because if the workloads would move to another Cluster in the vSphere environment connected to other leafs, the APIC would learn that move and update the information accordingly. The policy also follows the VM as it moves of course.
Now let’s assume that port 1/26 on troy-leaf3 did go down one way or another. Clearly that would trigger an event/log/trap coming from the corresponding leaf. But does that long alone help us assess what the impact is? In ACI it does, and an easy way to do that is through Application and Tenant Health Scores.
ACI Health Scores
In ACI, the APIC is keeping track of all events, configuration changes, statistics and faults. Faults are handled as a managed object that is a child of the affected object in the MTI. For every fault, a record object is created in the fault log. The Health Scores are built based on rolled up faults between related objects, and provide a quick overview of the health of the system, modules, tenants, applications, etc.
The health score has a range of 0 to 100, the perfect health score. Each fault reduces the health score of the affected object based on the severity of the fault, and the health score is propagated to the container and related managed objects. Discussing the detailed implementation of the Health Scores is beyond the scope of this post, but suffice to say that when the port 1/26 went down, this triggered a downgrade of the Health Score of the port to zero, and consequently this rolled up to the Health Score of the JoomlaApp application to that was downgraded to 68. It is important that not all uEPGs of the application were impacted. For instance, some had no endpoints connected on the affected ESXi host. JoomlaWeb-Prod however was affected, and by clicking on the health score value of this uEPG we can quickly move to the health score tree and identify the root cause problem, as seen below:
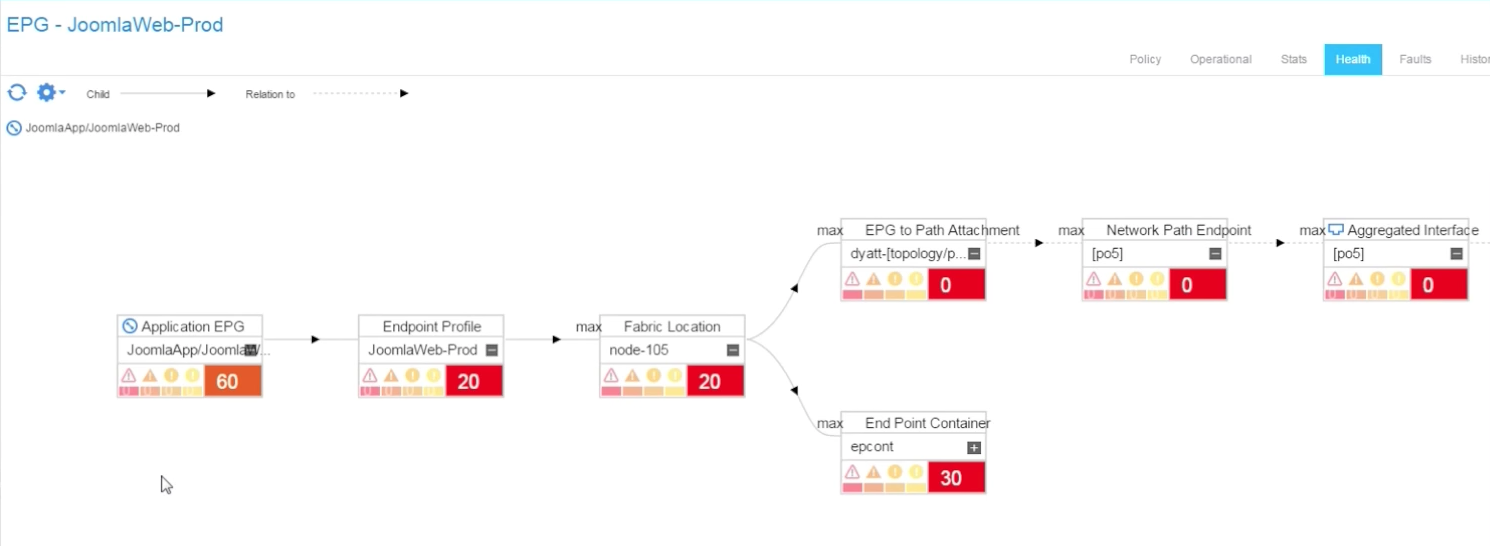
In this case, we already knew what the source problem was (because, we created the problem for the demo). But I hope the reader can see that this is very useful, since a single glance at a tenant’s dashboard can help identify issues by looking at the tenant’s health score. Then, very quickly you can see specific application and/or EPG health scores and soon after expand the view, as we did above, to root cause the problem.
In the demo video we also show how these fabric health scores are exposed to the vCenter admin via the ACI vCenter Plugin, like you can appreciate on the screenshot below:
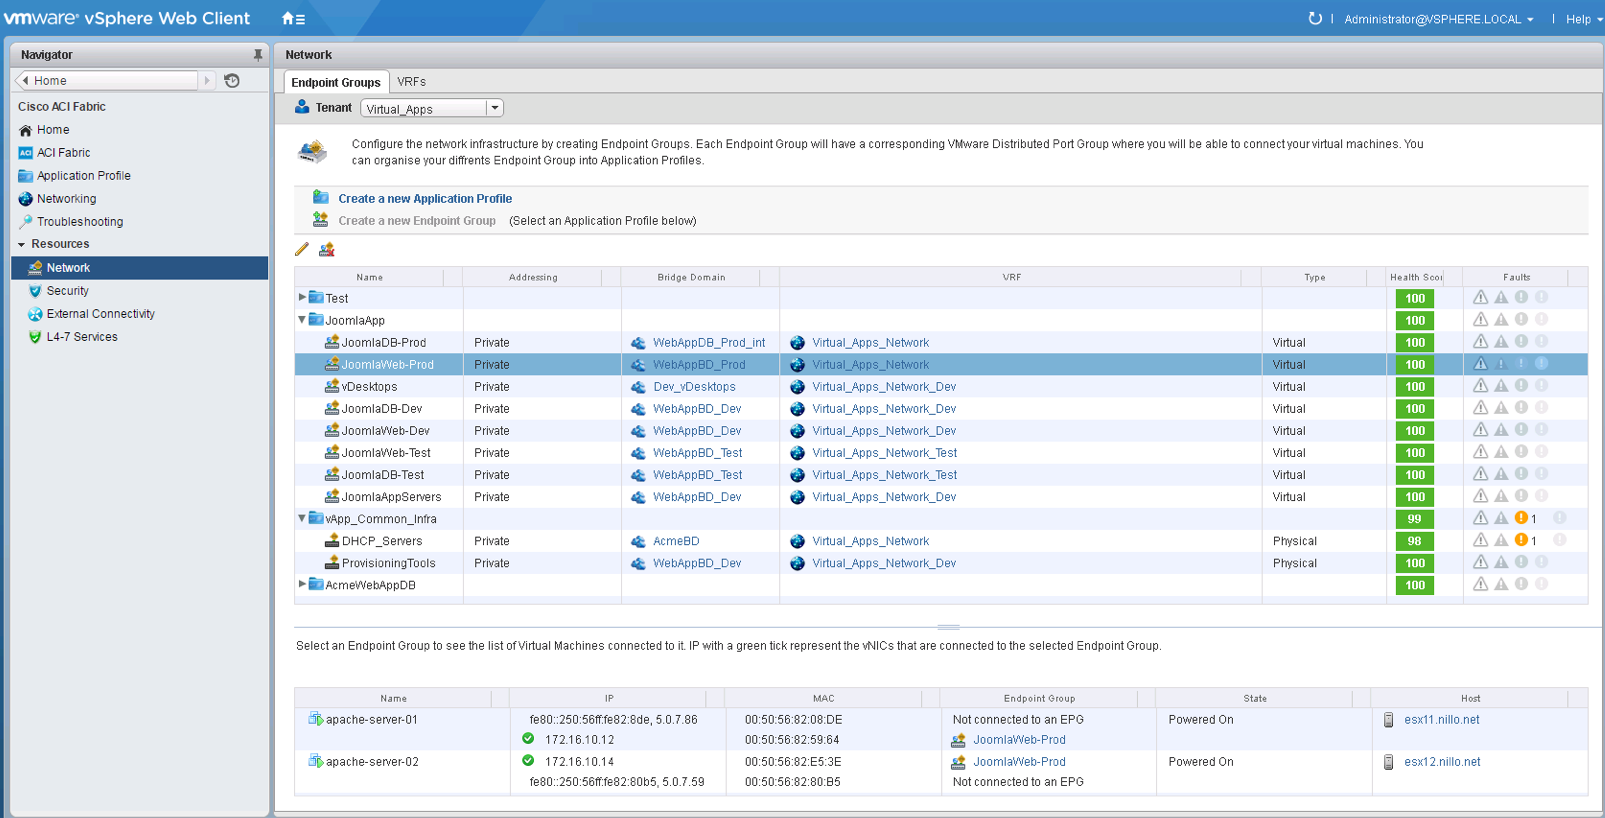
The ACI vCenter Plugin is supported since APIC 2.0 and is an entirely optional component. When used, it provides the vSphere administrator with an option to manage and/or view elements of the fabric. As you can see in the screen shot from above, you can see the health scores of each application and EPG and the associated fabric events and faults, if any.
This works for regular EPGs and also for attribute-based uEPGs, like the JoomlaWeb-Prod above.
Troubleshooting Connectivity Problems
But what happens when things break at a point in time and then they are back to normal. That is, a transient failure, where you try to identify what went wrong?
We can’t provide a definitive answer to every such scenario, but we can certainly contribute to solving a number of those. In the demo I simulate a human error. I imagine that while the application is in testing stage, someone made a configuration mistake on the filters of the test environment, then realised the mistake and fixed it a few minutes after. This broke the connectivity for a while, affecting a script testing the application.
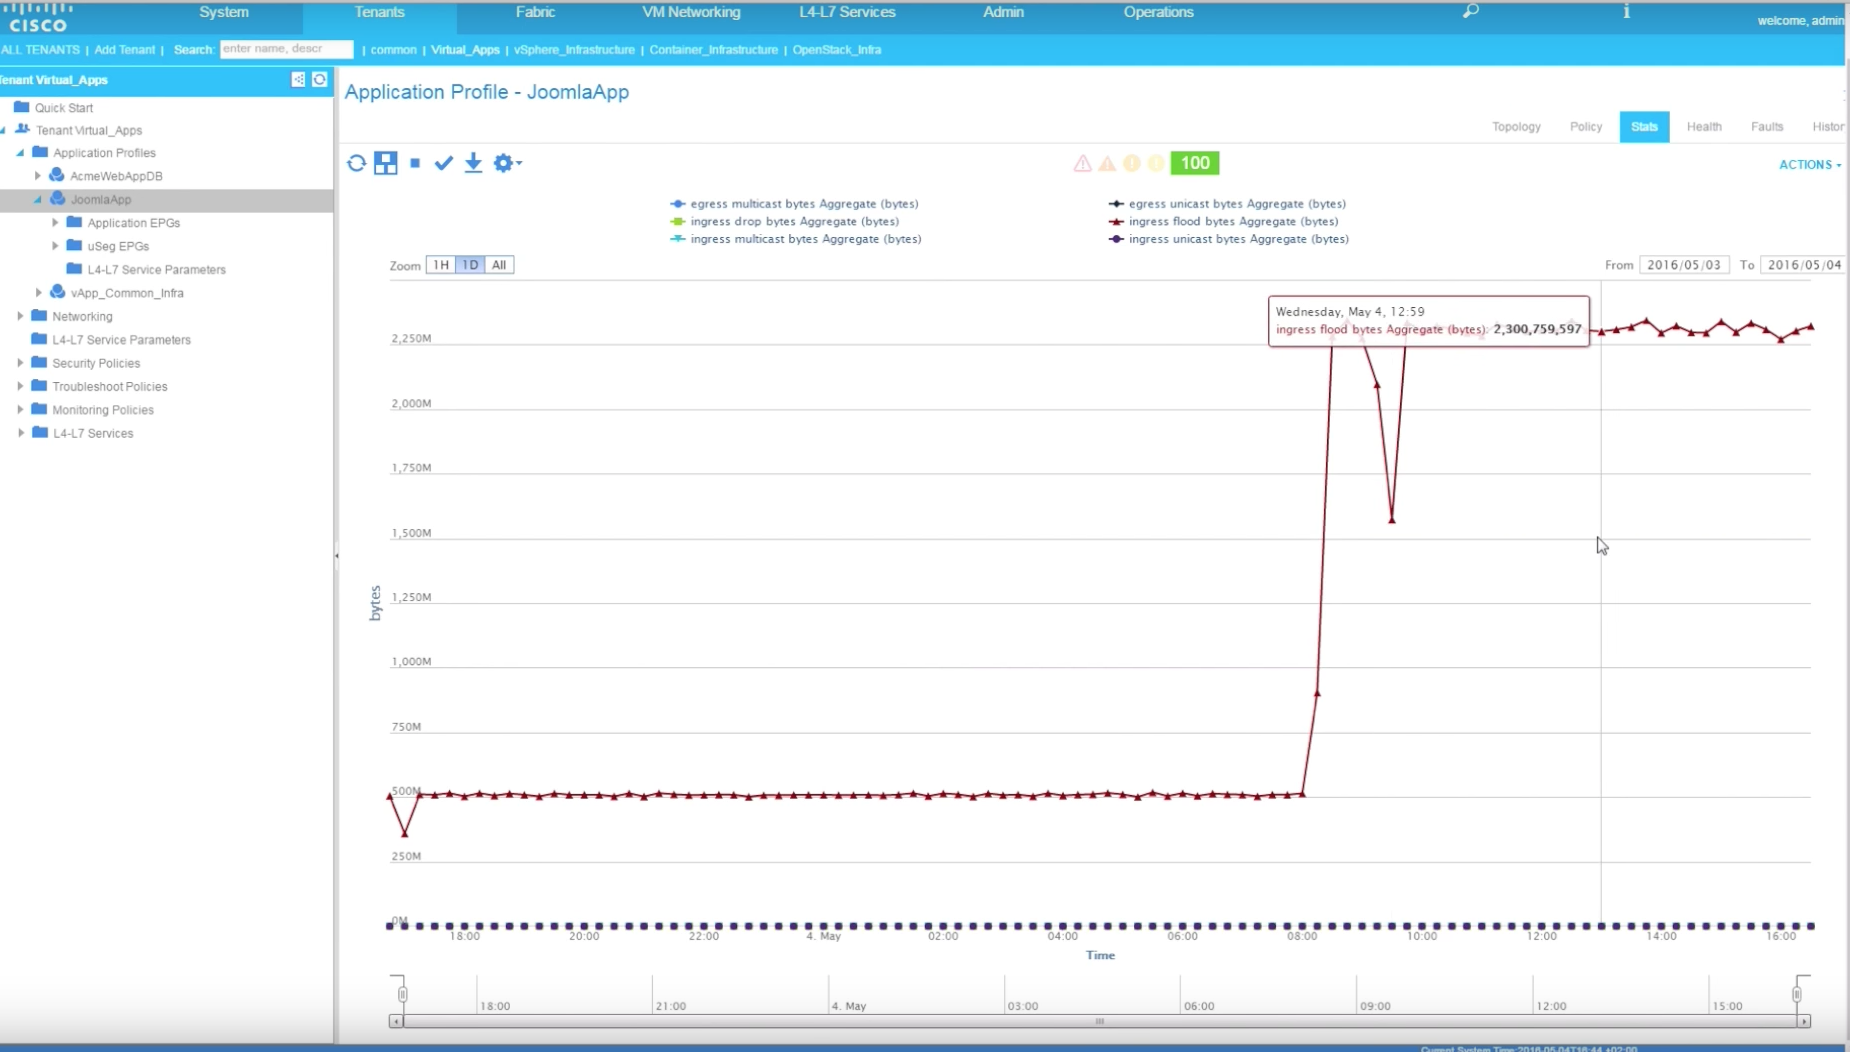
Then on the demo, I pretend that another engineer reviewing the results of the running test discovers a problem: the script testing the new version of the web page failed at some point. This engineer looks at the traffic stats on the ACI vCenter Plugin and notices a glitch in traffic at the time when the script failed. Therefore the engineer is assuming the problem was with the network:
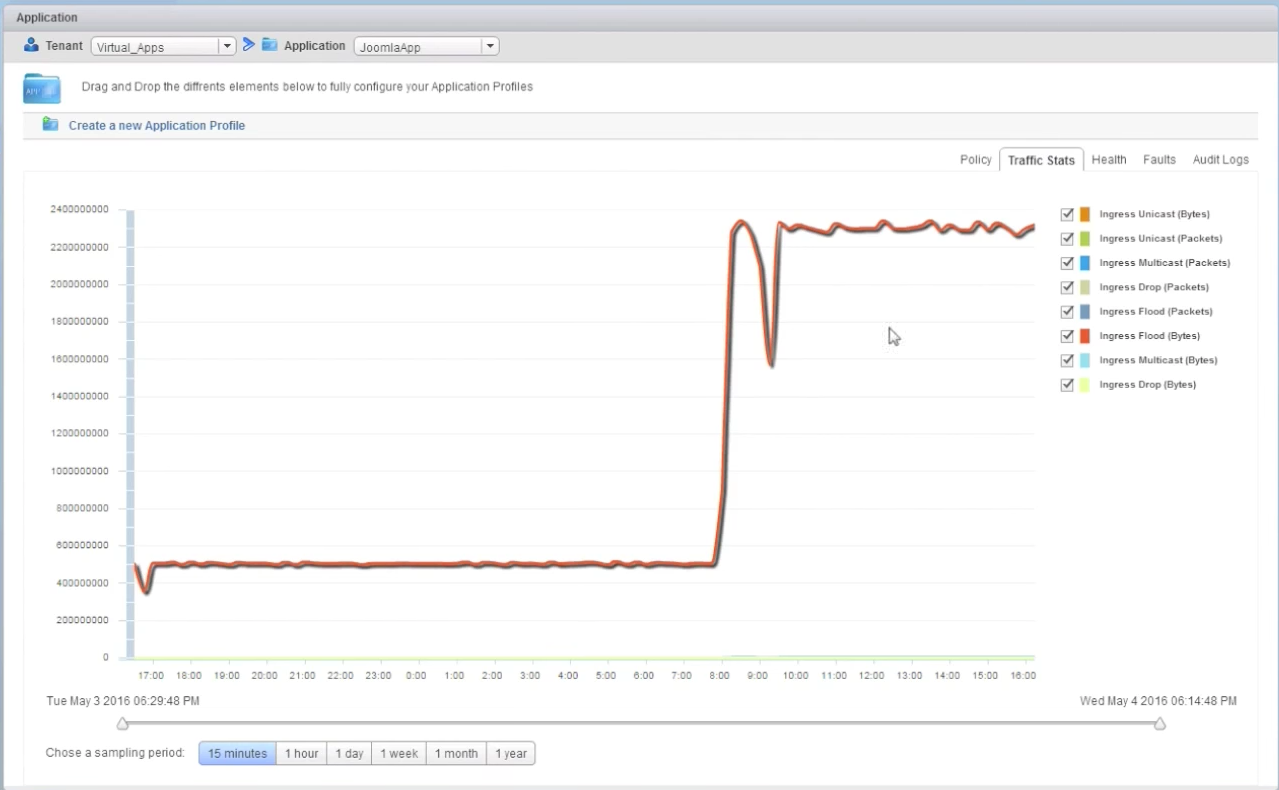
When the network team is contacted about it, the fabric admin can see the exact same glitch looking at the stats of the application. This in itself looks very simple, but on a traditional network that is managed box-by-box based on VLANs and ports, just correlating the statistics of the right ports, VLANs, SVIs, etc. can take quite some time to actually get to the same level of information (to begin with, you need to know the ports involved!).
In the event, we also know the specific VM involved in the testing, and now it is easy in APIC for the fabric administrator to search for the names of the specific VMs that are involved, and quickly find out where they are in both terms of vCenter and physical connectivity.
Also, once this is known, and since we know the time window when the problem happened, we can use the ACI Visibility and Troubleshooting Tool to have APIC draw for us the path between the endpoints involved, as below:
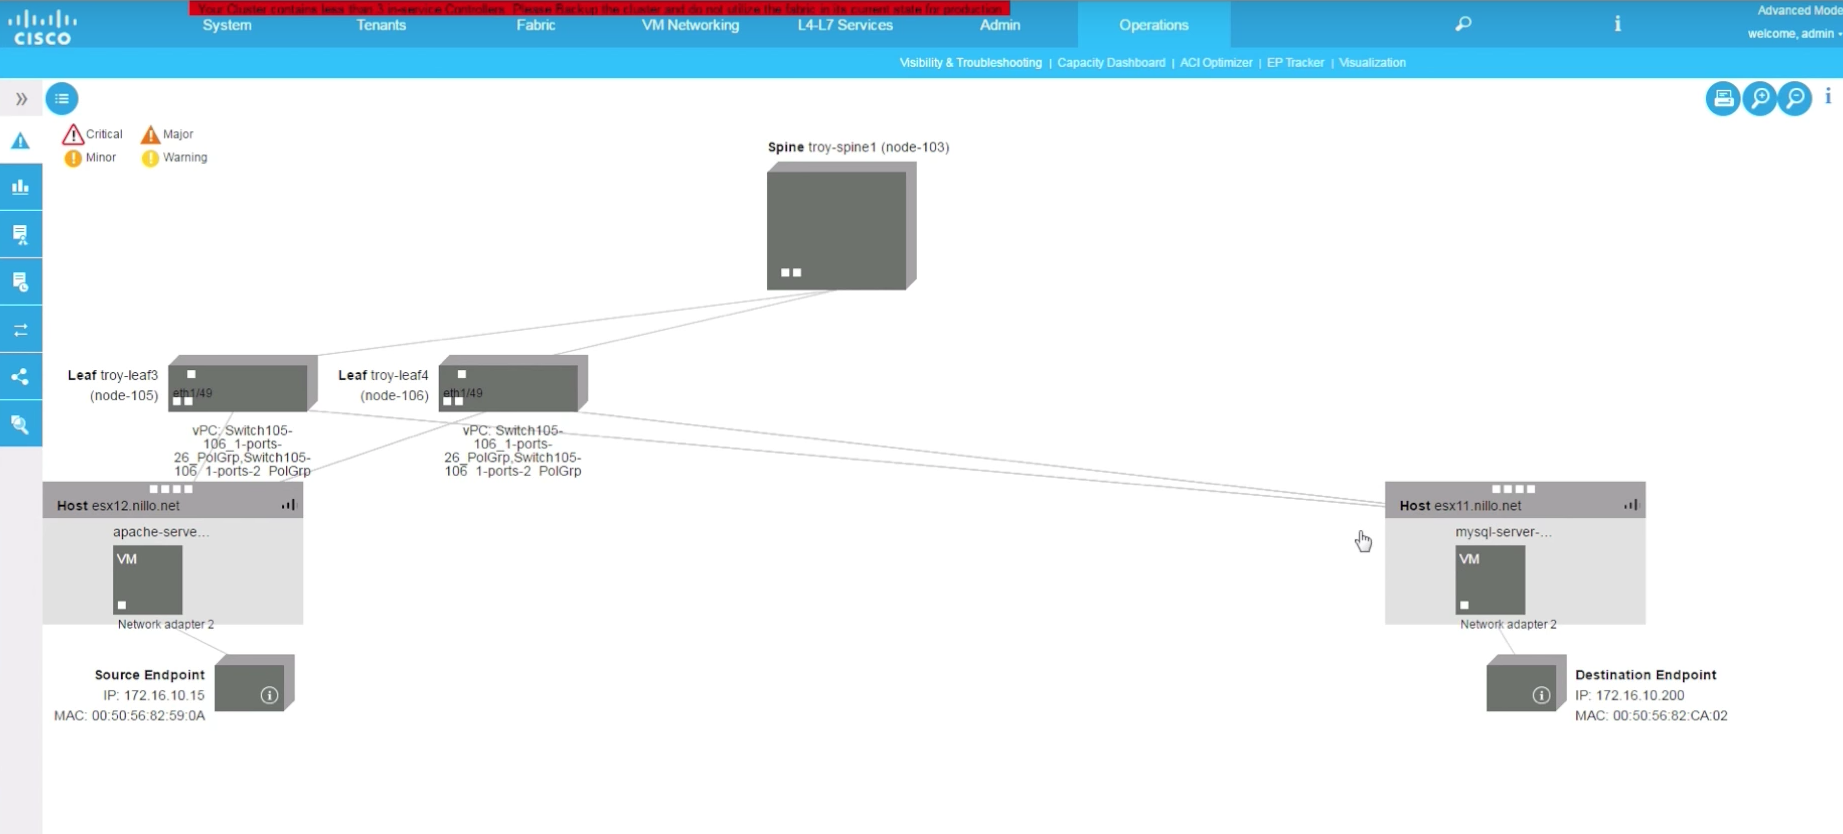
This gives us a lot of information for troubleshooting. We know in one view all network devices involved, the path between the endpoints (including L4-7 service appliances if there are any in the path), their IP/Macs, on which hosts they run, etc.
We can also quickly pull in all information about the contracts that is relevant for the communication of those specific endpoints, and similarly pull in the statistics, logs, events and faults that are relevant to that pair of endpoints during the time window we selected. All is already filtered out for us.
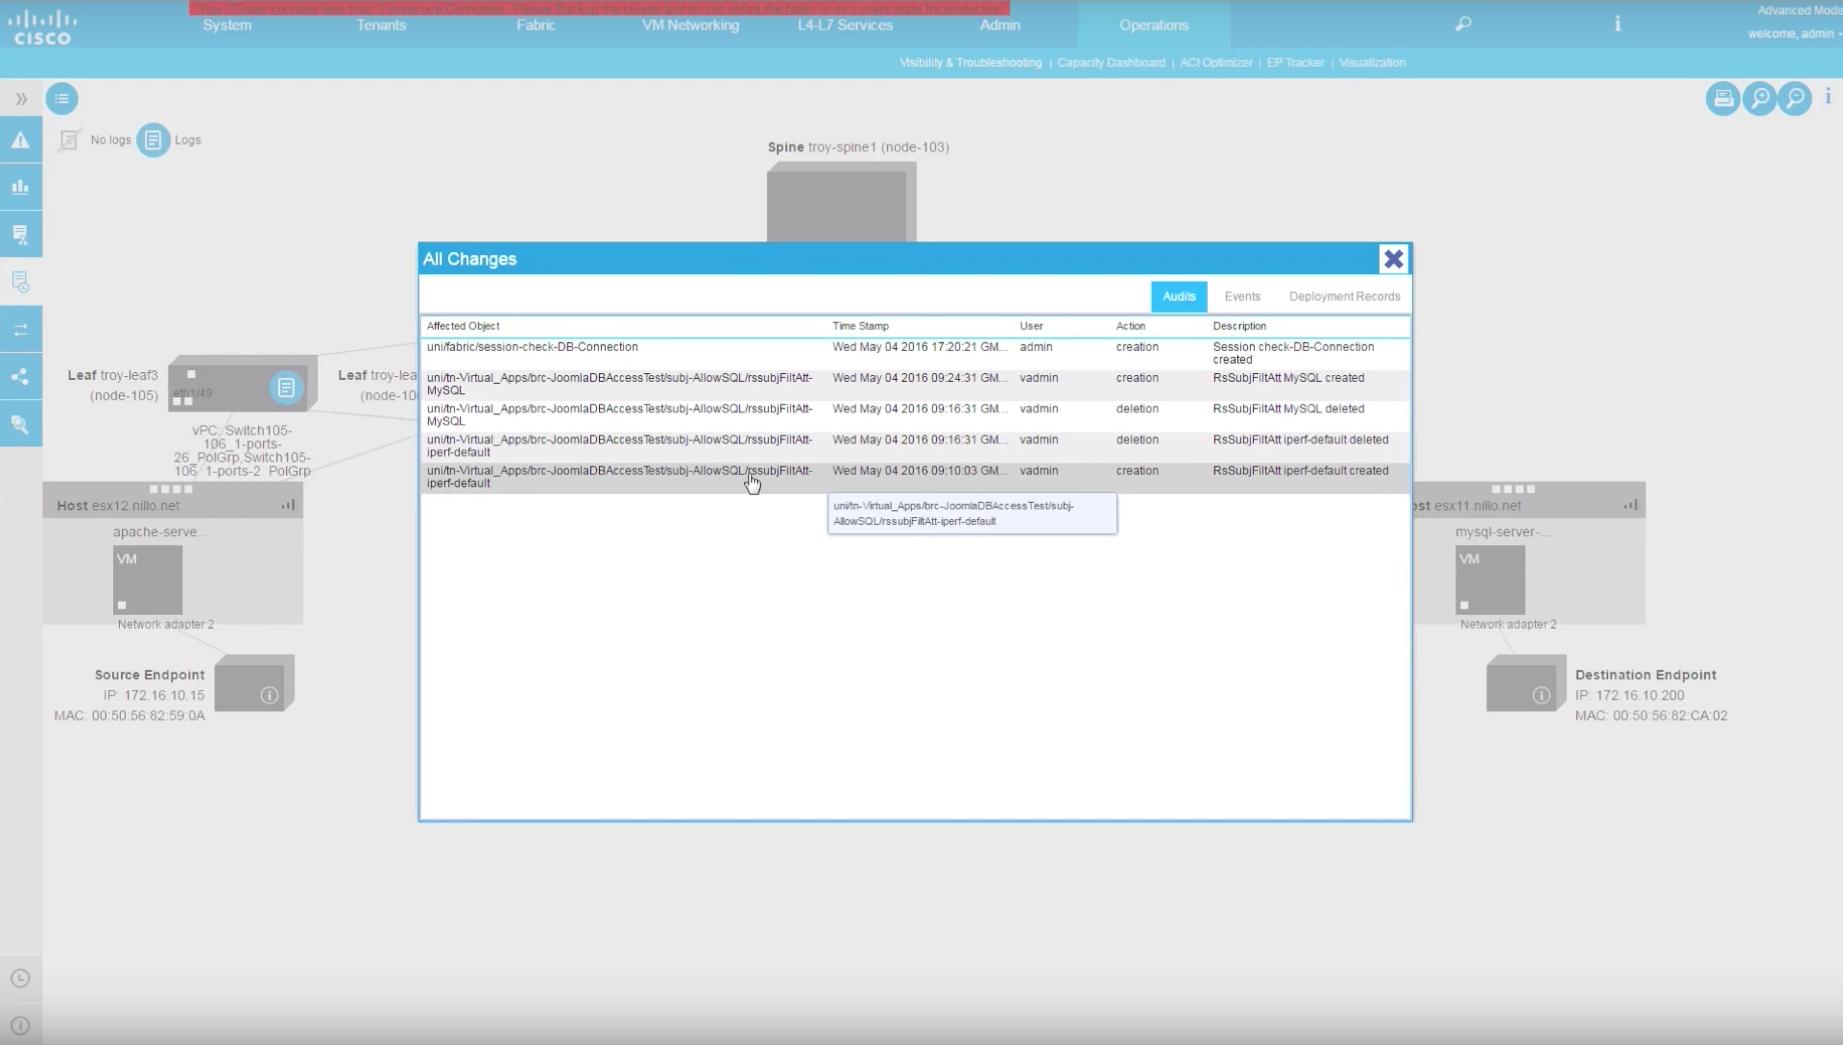
And in addition, we can also see a detailed Audit of all network changes that could have impacted that communication path during that selected time window. In the event, it is easy to spot that a filter was removed from the contract, thus breaking connectivity, right at the time of the network glitch and quickly added back a few minutes after. We can see what filter was removed and added back, and we can also see who made that mistake … ehem … change.
Conclusions
The examples above show the advantages of ACI in terms of simplification and the visibility when it comes to day-2 operations and troubleshooting. These advantages, exposed through the examples above, come from the fact that the underlay and the overlay are automatically correlated and under a single policy and management controller. Of course, this is also true when using Micro EPGs as we have seen already.
Using Micro Segmentation to enhance the security posture inside the Data Center and/or to simplify dynamic policy changes (like when moving from dev to test to prod) is great, but it is very important to do this in a way that is operationally simple.
If you reflect about what we did here, and you imagine a traditional box-by-box managed network combined with a traditional software-only network virtualisation solution, you can see the great advantage of the ACI model.
To quickly see what the impact that network changes have on specific applications, or in the reverse way, to see the application health from a network perspective and quickly see the specific events affecting it. To have automated correlation of every possible network or policy change, audit it, and see the impact it has on applications … To do these things in a traditional underlay with a separated overlay you would need to pull logs, stats, audits and event information from a lot of different systems. But that is not it … you would also need a lot of different tools to process that information, and more important, you would need to provide the intelligence to be able to correlate what information is relevant to one another. Furthermore, every time you make changes, every time you provision new applications, you would need to update all of that intelligence across a number of different tools.
In the case of the ACI, a single tool is required: the APIC. And at the same time, all that information is ready and at hand for other tools if/when needed through a single, open and well documented API.
Finally, you may want to checkout the demo. If you read through the blog you may skip the intro and go directly to minute 2:30.


Hi Juan,
Well done! very informative and very piratical!!
Please keep it up 🙂
great post! i love it