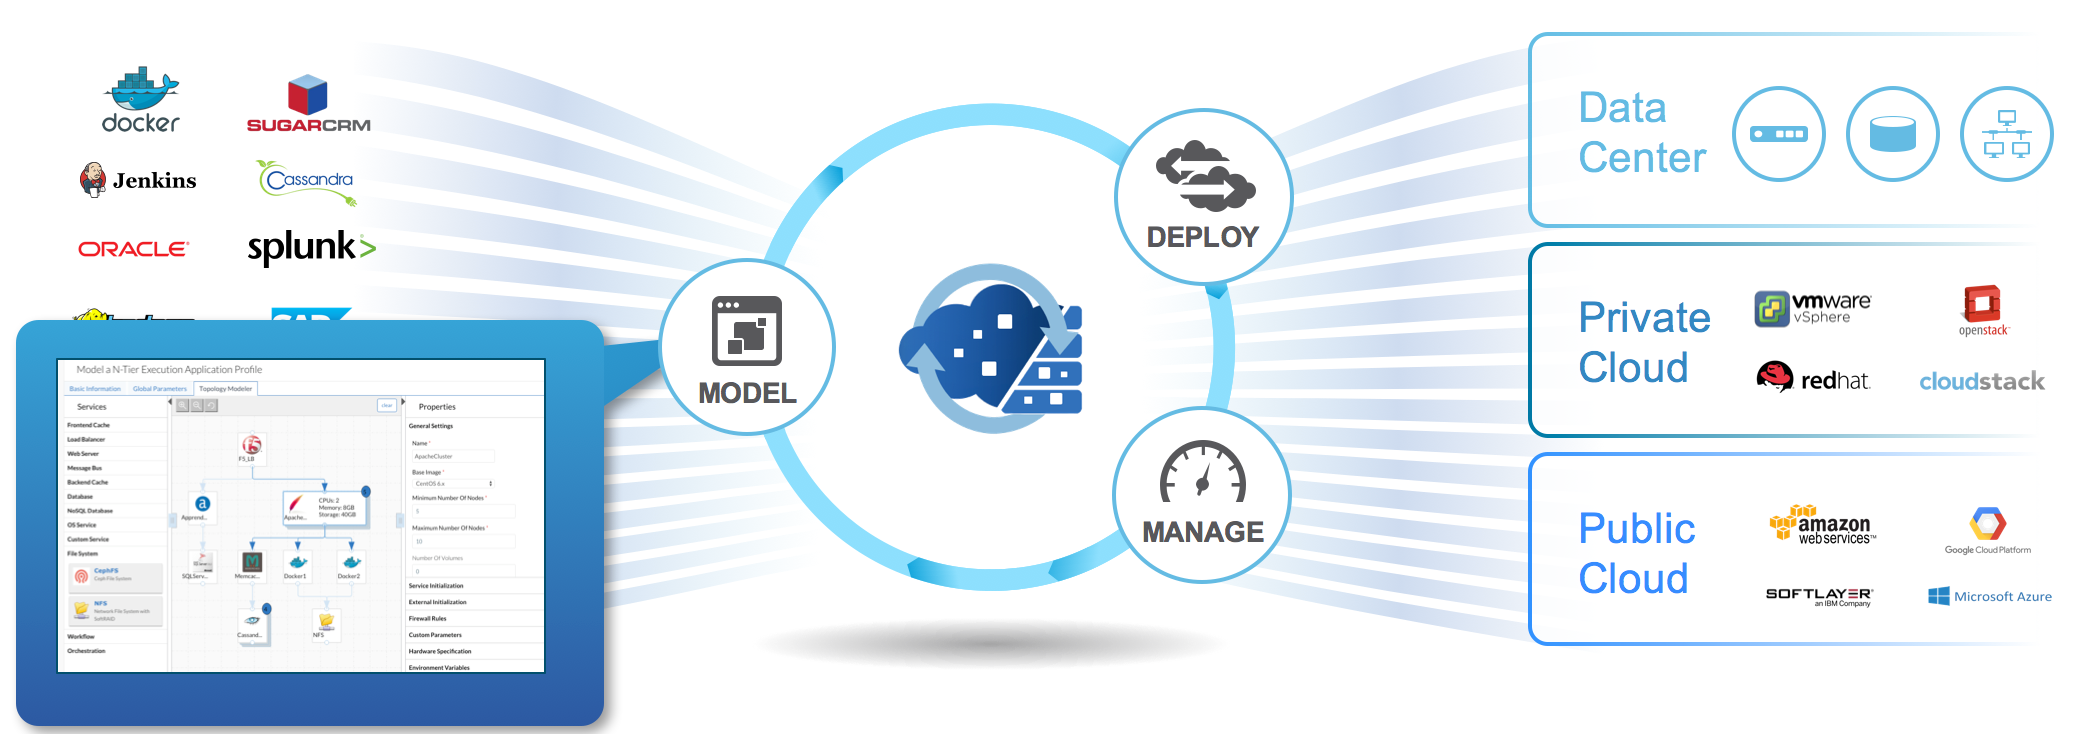
A very common goal for software designers and security administrators is to get to a Secure Zero-Trust model in an Application-Centric world.
They absolutely need to avoid malicious or accidental outages, data leaks and performance degradation. However this can be very difficult to achieve sometimes, due to the complexity of distributed architectures and the coexistence of many different software applications in the modern shared IT environment.
Two very important steps in the right direction can be Visibility and Automation. In this blog, we will see how the combination of two Cisco software solutions can contribute towards achieving this goal.
This is the description of a lab activity, that we implemented to show the advantage from the integration of Cisco Tetration Analytics (providing network analytics) with Cisco CloudCenter (application deployment and cloud brokerage), creating a really powerful solution that combines deep insight into the application architecture and into the network flows.
Telemetry from the Data Center
Cisco Tetration Analytics captures telemetry from every packet and every flow, delivers pervasive real-time and historical visibility across your data center, providing a deep understanding of application dependencies and interactions. You can learn more here: http://cs.co/9003BvtPB.
Main use cases for Tetration are:
- Pervasive Visibility
- Security
- Forensics/Troubleshooting, Single Source of Truth
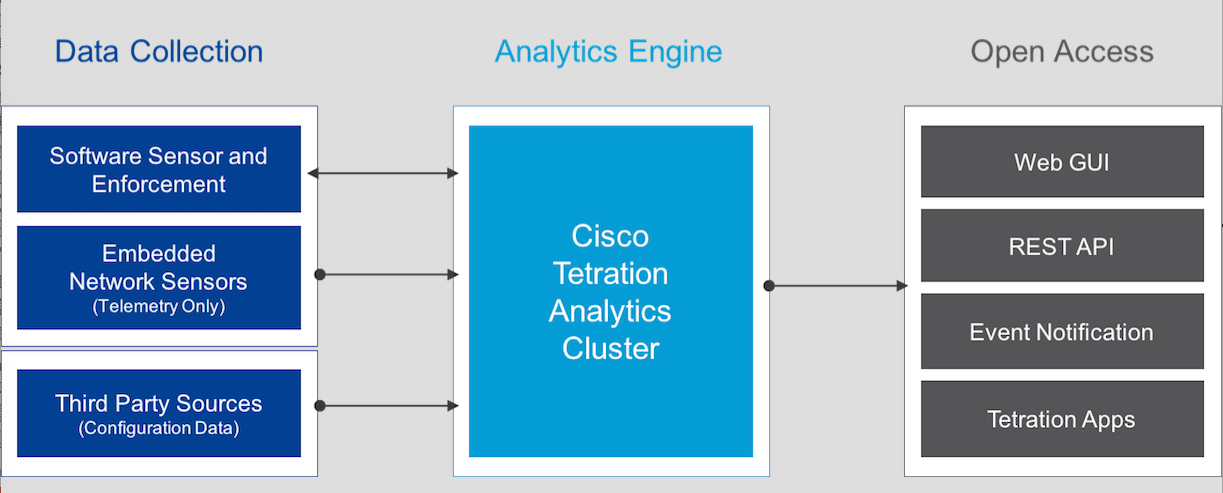
The architecture of Tetration Analytics is made of a big data analytics cluster and two types of sensors: hardware and software based. Sensors can be either in the switches (hw) or in the servers (sw).
Data is collected, stored and processed through a high performance customized Hadoop cluster, which represents the very inner core of the architecture. The software sensors will collect the metadata information from each packet’s header as they leave or enter the hosts. In addition, they will also collect process information, such as the user ID associated with the process and OS characteristics.
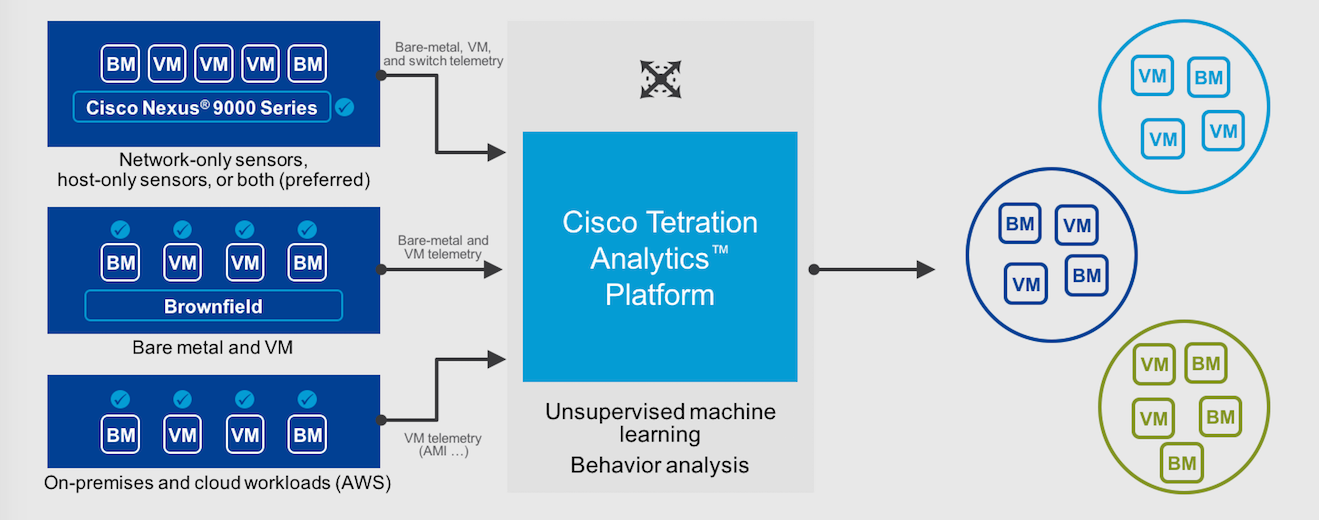
Tetration can be deployed today in the Data Center or in the cloud (AWS). The choice of the best placement depends on whether you have more deployments on cloud or on premises.
Thanks to the knowledge obtained from the data, you can create zero-trust policies based on white lists and enforce them across every physical and virtual environment. By observing the communication among all the endpoints, you can define exactly who is allowed to contact who (white list, where everything else is denied by default). This applies to both Virtual Machines and Physical Servers (bare metal), including your applications running in the public cloud.
As an example, one of your database servers will be only accessed by the application servers running the business logic for that specific application, by the monitoring and backup tools and no one else. These policies can be enforced by Tetration itself or exported to generate policies in an existing environment (e.g. Cisco ACI).
Another benefit of the network telemetry is that you have visibility on any packet, any flow at any time (you can keep up to 2 years of historical data, depending on your Tetration deployment and DC architecture) among two or more application tiers. You can detect performance degradation, ie increasing latency between two application tiers and see the overall status of any complex application.
How to onboard applications in Tetration Analytics
When you start collecting information from the network and the servers into the analytics cluster, you need to give it a context. Every flow needs to be associated to applications, tenants, etc. so that you can give it business significance.
This can be done through the user interface or through the API of the Tetration cluster, matching metadata that come associated with the packet flow. Based on this context, reports and drill down inspection will give you an insight on every breath that the system does.
Automation makes Deployment of Software Applications secure and compliant
The lifecycle of Software Applications generally impacts different organizations in the IT, spreading responsibility and making it hard to ensure quality (including security) and end-to-end visibility.
This is where Cisco Cloud Center comes in. It is a solution for two main use cases:
- modeling the automated deployment of a software stack (creating a template or blueprint for deployments)
- brokering cloud services for your applications (different resource pools offered from a single self-service catalog). You can consume IaaS and PaaS services from any private and public cloud, with a portable automation that frees you from lock-in to a specific cloud provider.
See also my previous posts (Just 1 step to deploy your applications in the cloud(s) and Hybrid Cloud and your applications lifecycle: 7 lessons learned).
Integration of Automated Deployment and Network Analytics
It is important to note that both platforms are very open and come with a significant support for integration API. The joint usage means benefitting from the visibility and the automation capabilities of each product:
CloudCenter
- Application architecture awareness (the blueprint for the deployment is created by the software architect)
- Operating System visibility (version, patches, modules and monitoring)
- Automation of all configuration actions, both local (in the server) and external (in the cloud environment)
Tetration Analytics
- Application Dependency Mapping, driven by the observation of all communication flows
- Awareness of Network nodes behavior, including defined policies and deviations from the baseline
- Not just sampling, but storing and processing anytime metadata for any single packet in the Data Center
The table below shows how each engine provides additional value to the other one:
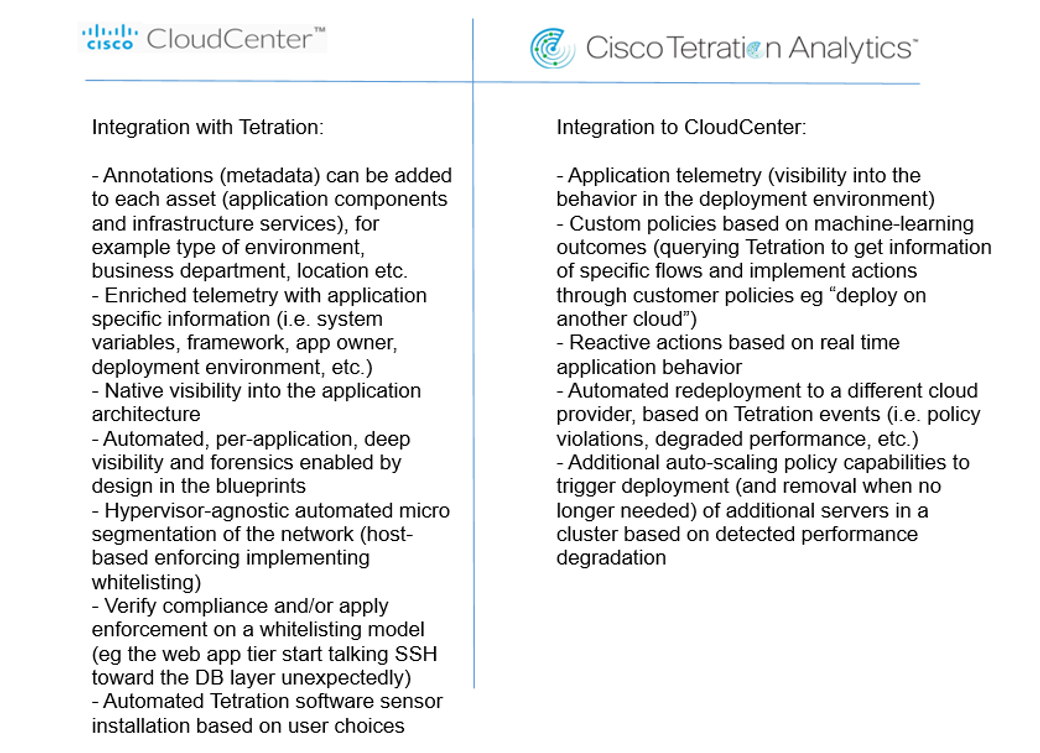
Leveraging the integration between the two solutions allows a feedback loop between applications design and operations, providing compliance, continuous improvement and delivery of quality services to the business.
Consequently, all the following Tetration Analytics use cases are made easier if all the setup is automated by CloudCenter, with the advantage of being cloud agnostic:
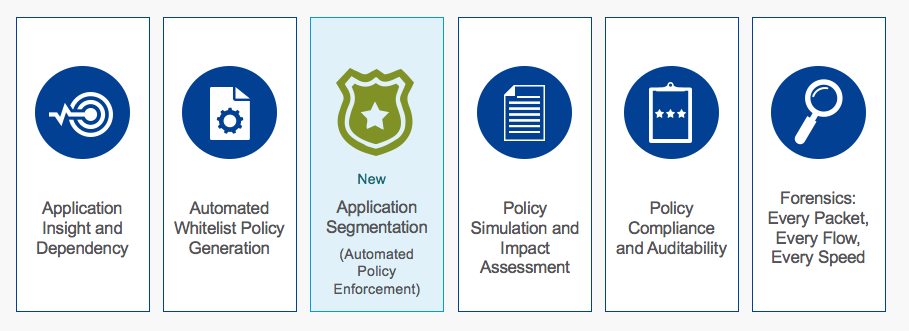
Of course one of the most tangible results claimed by this end-to-end visibility and policy enforcement is security.
More detail on the integration between CloudCenter and Tetration Analytics will be described in the next post, where we will demonstrate how easy it is to automate the deployment of software sensors along with the application, as well as preparing the analytics cluster to welcome the telemetry data.
Credits
This post is co-authored with a colleague of mine, Riccardo Tortorici.
He is the real geek and he created the excellent lab for the integration that we describe here, I just took notes from his work.
References
Cisco Tetration Analytics Overview
Cisco Tetration Analytics Platform
Cisco Tetration Analytics Platform Data Sheet
