
I remember when 1 Mbps was big bandwidth. And 45 Mbps was unbelievably, outlandishly huge bandwidth. One spring day in 1995, at the headquarters of a large technology company outside of Dallas, there was excited chatter at the proverbial water cooler about the T3 access line that was being installed. A T3 line! Nearly 45 Mbps! Every thing really is bigger in Texas! We wondered what we would do with all that bandwidth, even though there were thousands of us at the location being served. Now, in 2015, the average broadband home has a 25 Mbps connection, and 20% of broadband homes worldwide have T3 speeds or higher, serving just the members of that household. And we now talk about yesterday’s data speeds the way “baby boomers” talk about the prices of convertibles and one-bedroom detached houses generations ago.
Reflections of this sort were frequent this summer, as the Visual Networking Index (VNI) team had a chance to catch our breaths from our usual schedules and take a look at the long history of Internet traffic. With this blog, we are posting our historical traffic figures for global Internet and IP traffic, from 1984 through 2014. (See end of blog post for data.) A second blog post to be published within a few weeks will explore this data in detail, but as a first step let’s look at the sheer volume of the growth. It’s huge. Too huge for a bar chart or line graph, so we’ve represented Internet traffic volume as bubbles below, but even here we had to exaggerate the 1984 and 1994 bubbles to make them visible.
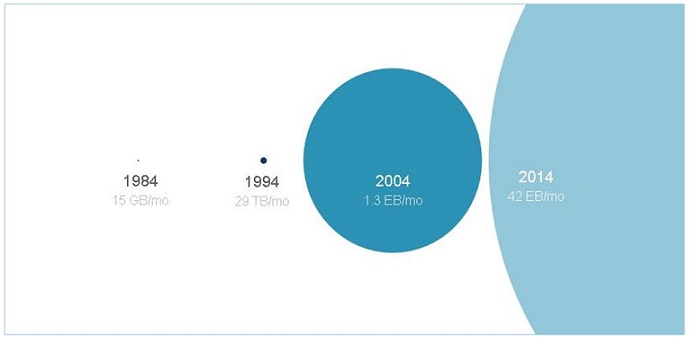
There are a few astounding figures that emerge from looking at the historical data.
- In 1984, total global Internet traffic was 15 Gigabytes per month. By 2014, the average Internet traffic per user was 15 Gigabytes per month. Each one of us generates more traffic than crossed the entire global Internet 30 years ago.
- By the same token, Internet traffic in 2014 was 2.7 billion times higher than Internet traffic in 1984. Traffic in 2014 was 42.4 Exabytes per month, compared to 15 Gigabytes per month in 1984.
- The entire 1984 Internet volume crosses the 2014 Internet every hundredth of a second.
It may be a bit unfair to take 1984 as our starting point for the increase in Internet traffic. After all, the nature of growth rates is that they will be absurdly high in the first few years of any even modestly successful product or industry, since the base starts from nothing and moves to something. Let’s take 2000 as our starting point instead. It was the height of the Internet boom. Amazon and Google were already cornerstones of the online universe. And 2000 doesn’t seem so very long ago by other measures. A gallon of milk costs about the same as it did then, taking inflation into account. The differences in fashion since then have been more evolutionary than revolutionary. (At least that’s what I tell myself when looking in the closet each morning.) Reality TV was already entertaining audiences in 2000, as they do today.
So perhaps the traffic growth rates are not so astronomical from 2000 to 2014, right? Not so. By the measure of Internet traffic, 2000 seems very distant indeed. Internet traffic in 2014 was over 564 times what it was in 2000. For fun, we’ve compiled a mixed bag of metrics for a quick “then and now” comparison of 2000 and 2014.
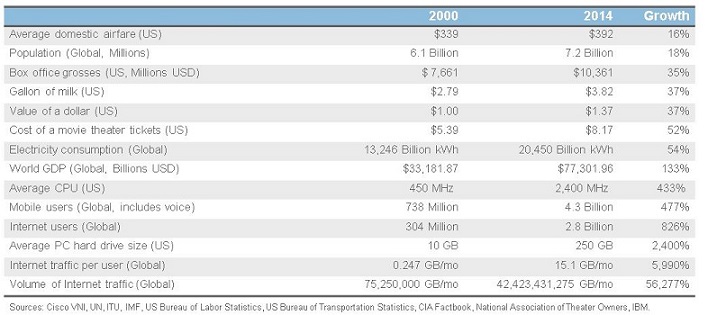
In the growth column, Internet traffic dominates the list, by far. There are few metrics in any industry that compare. Traffic is a summary metric that reflects multiple facets of Internet evolution. Internet traffic is the culmination not only of user and device growth, but of growing usage, application trends, and increasing bandwidth availability. While adoption figures and download statistics signal the transformative social impact of the Internet, traffic metrics account for our sense of the Internet as something transcendent; our sense that it is growing faster than our ability to fathom.
How high can Internet consumption go?
Is there a limit? We are often asked this question as we describe the latest VNI findings throughout the year. While year-over-year Internet growth rates have been leveling out for some time, we don’t expect them to drop below 20% in the foreseeable future. There is strong growth coming from mobile (cellular) networks, content is increasingly high-definition, and machines are starting to populate the Internet at a rapid pace. Even without these growth drivers, the fact remains that people continue to consume a lot of content that doesn’t yet touch the Internet. While Internet traffic is just 15 Gigabytes per month, individuals consume hundreds of gigabytes of additional data in the form of broadcast television, broadcast radio, digital content stored on storage drives, and (last but not least) video games amount to hundreds of gigabytes per month. Just in the last year, on-board console storage increased enough to allow gamers to download their graphically rich games instead of acquiring them on disc. The game downloads are moving the needle on traffic, and we expect video game downloads to account for a full 5% of fixed consumer Internet traffic by 2019.
Not long ago, our team played around with a few high-consumption scenarios to predict key bandwidth drivers. We ended up convinced that certain applications could require a household bandwidth of 1 Gbps, and even 10 Gbps of bandwidth would not be excessive. One of the key ‘killer apps’ for bandwidth, mundane is it sounds, is file transfer. Instant file transfer requires high bandwidth. Transferring a 10 Gigabyte file within a few minutes requires 300 Mbps. Instant file transfer is required for true cloud applications, real-time backup and cloud storage, and certain kinds of data-intensive telework. Consider an on-call doctor who needs to receive a 1 Gigabyte medical image in real-time while consulting with colleagues about a patient. To receive this file in 4 seconds would require bandwidth of 2 Gbps.
If there is a natural limit to Internet consumption, we haven’t reached it yet. There may a period of slower Internet growth before we see some of these trends become prevalent, but the potential is there for substantially more Internet consumption in the future. Perhaps in 2030 we will be reflecting with amusement about how we used to think 15 Gigabytes per month per user was an impressive amount of traffic.
Stay tuned for the next blog post, to be published within a few weeks, where we will explore the inflections points of traffic growth over the past 30 years.
Historical Global Internet Traffic Data, 1984 through 2014
| Year | Traffic (GB/mo) |
| 1984 | 15 |
| 1985 | 33 |
| 1986 | 65 |
| 1987 | 128 |
| 1988 | 252 |
| 1989 | 498 |
| 1990 | 1,000 |
| 1991 | 2,002 |
| 1992 | 4,444 |
| 1993 | 8,715 |
| 1994 | 25,830 |
| 1995 | 150,500 |
| 1996 | 1,200,000 |
| 1997 | 5,000,000 |
| 1998 | 11,200,000 |
| 1999 | 25,500,000 |
| 2000 | 75,250,000 |
| 2001 | 175,000,000 |
| 2002 | 356,000,000 |
| 2003 | 681,050,000 |
| 2004 | 1,267,800,000 |
| 2005 | 1,802,745,619 |
| 2006 | 2,910,579,371 |
| 2007 | 4,477,367,718 |
| 2008 | 6,491,159,470 |
| 2009 | 9,301,984,735 |
| 2010 | 13,751,003,569 |
| 2011 | 19,974,008,812 |
| 2012 | 26,214,897,380 |
| 2013 | 32,798,830,927 |
| 2014 | 42,423,169,029 |
Have questions or comments – Tweet us @CiscoVNI!


Staggering numbers. I like Domo’s infografic “Data Never Sleeps” representation of how much internet traffic we make/consume each minute. Look at https://www.domo.com/blog/2015/08/data-never-sleeps-3-0/.
It is amazing to see howe much data we use but i think we will be even more amazed by the amount of data we will be consuming within 10 years
how much data*
thanks so much for this great article. Like many I am sure who used the Internet before it became the WWW this data does not surprise but it is still astonishing – if that makes any sense 🙂 the first modem I installed was a 1200baurd connecting a 3174 to a FEP, I worked with a guy who was training me that could tell which dip switches were set by the tones on the line so all that noise was useful to some 🙂 I tenner saying to someone once when the 56kbps Modem first came out “there is no way they will squeeze more speed out of a phone line” then a little while later I had ISDn at home and then the ability to bond the channels of my 128k I was amazed. I tell my kids this and they glance up from one of the 5 devices they each have connected and look at me like I am a dinosaur – hey maybe I am 🙂
Wow, thanks for the amazing information and for collating it for us. I remember using the old dial up with AT command set running to VIEW a bulletin at a baud rate at 1200 to 2400.
It is quite staggering the pure volume of data that is now used, I suppose what we dont always consider is the amount of storage that is required to store all this data. Thanks for the really interesting information.
Great article – thought provoking! Definitely agree with the statement below: Lifelong learning and re-invention will be the keys to staying innovative and disruptive in the work we do and in our careers.
Plotting this on a log scale shows a clear logistic curve.