
Contents
Intro
The ELK stack is a set of analytics tools. Its initials represent Elasticsearch, Logstash and Kibana. Elasticsearch is a flexible and powerful open source, distributed, real-time search and analytics engine. Logstash is a tool for receiving, processing and outputting logs, like system logs, webserver logs, error logs, application logs and many more. Kibana is an open source (Apache-licensed), browser-based analytics and search dashboard for Elasticsearch.
ELK is a very open source, useful and efficient analytics platform, and we wanted to use it to consume flow analytics from a network. The reason we chose to go with ELK is that it can efficiently handle lots of data and it is open source and highly customizable for the user’s needs. The flows were exported by various hardware and virtual infrastructure devices in NetFlow v5 format. Then Logstash was responsible for processing and storing them in Elasticsearch. Kibana, in turn, was responsible for reporting on the data. Given that there were no complete guides on how to use NetFlow with ELK, below we present a step-by-step guide on how to set up ELK from scratch and enabled it to consume and display NetFlow v5 information. Readers should note that ELK includes more tools, like Shield and Marvel, that are used for security and Elasticsearch monitoring, but their use falls outside the scope of this guide.
In our setup, we used
- Elasticsearch 1.3.4
- Logstash 1.4.2
- Kibana 3.1.1
For our example purposes, we only deployed one node responsible for collecting and indexing data. We did not use multiple nodes in our Elasticsearch cluster. We used a single-node cluster. Experienced users could leverage Kibana to consume data from multiple Elasticsearch nodes. Elasticsearch, Logstash and Kibana were all running in our Ubuntu 14.04 server with IP address 10.0.1.33. For more information on clusters, nodes and shard refer to the Elasticsearch guide.
Java
Elasticsearch requires a recent version of Java. That can be installed using
sudo apt-get install openjdk-7-jre
Elasticsearch
To download and run Elasticsearch, use the following:
curl -O https://download.elasticsearch.org/elasticsearch/elasticsearch/elasticsearch-1.1.1.tar.gz
  tar zxvf elasticsearch-1.1.1.tar.gz
  cd elasticsearch-1.3.4/
  ./bin/elasticsearch
Elasticsearch can also be started in the background using the -d option
./bin/elasticsearch -dAlternatively, someone that wanted to run Elasticsearch as a service could download the .deb file from the Elasticsearch download page and install it using
dpkg -i elasticsearch.debTo stop or start the Logstash service, use
  dpkg -i elasticsearch.deb
  sudo service elasticsearch restart / stop / status
Logstash
1. To run Logstash, just download the latest version tar.gz and extract the archive.
  curl -O https://download.elasticsearch.org/logstash/logstash/logstash-1.4.2.tar.gz
  zxvf logstash-1.4.2.tar.gz
  cd logstash-1.4.2
Then you can test that it works by manual sending logs to Logstash
bin/logstash -e 'input { stdin { } } output { stdout {} }'and type
hello worldLogstash should print the log:
2014-11-01T01:22:14.405+0000 0.0.0.0 hello worldTo test Logstash with Elasticsearch, tell Logstash to take the logs from standard input (console) and output them to Elasticsearch that is in the same server as Logstash using the following command:
  bin/logstash -e 'input { stdin { } }
      output { elasticsearch { host => localhost } }'
and type some text that will be the log that will be stored in Elasticsearch. Then check the Elasticsearch logs by going to h++p://10.0.1.33:9200/_search?pretty
More information can be found in the Logstash 1.4.2 tutorial.
Alternatively, someone that wanted to run Logstash as a service could download the .deb file from the Elasticsearch download page and install it using
dpkg -i logstash.debTo stop or start the Logstash service, use
  dpkg -i logstash.deb
  sudo service logstash restart / stop / status
2. Logstash configuration
Logstash can use static configuration files. Logstash comes with a NetFlow codec that can be used as input or output in Logstash as explained in the Logstash documentation. Below we will create a file named logstash-staticfile-netflow.conf in the logstash directory. The file will tell Logstash to use the udp plugin and listen on UDP port 9995 for NetFlow v5 records as defined in Logstash’s NetFlow codec yaml file. Logstash can consume NetFlow v5 and v9 by default, but we chose to only list for v5 here.
  input {
    udp {
      port => 9995
      codec => netflow {
        definitions => "/home/administrator/logstash-1.4.2/lib/logstash/codecs/netflow/netflow.yaml"
        versions => [5]
      }
    }
  }

  output {
    stdout { codec => rubydebug }
    if ( [host] =~ "10\.1\.1[12]\.1" ) {
      elasticsearch {
        index => "logstash_netflow5-%{+YYYY.MM.dd}"
        host => "localhost"
      }
    } else {
      elasticsearch {
        index => "logstash-%{+YYYY.MM.dd}"
        host => "localhost"
      }
    }
  }
Note that in the configuration file above, if the source of the NetFlow is one of 10.1.11.1 or 10.1.12.1, the data is exported to Elasticsearch in an index named logstash_netflow5-YYYY.MM.dd where YYYY.MM.dd is the date the data was received. The rest of the collected data that come from different sources will be stored in indices named logstash-YYYY.MM.dd. That way we use different indices for NetFlow from our sources of interest. As we will see later, the index will be use in Kibana to only view logs of interest. Separate daily indices also make it easier to purge data.
The Logstash configuration file can then be tested for errors and used in Logstash to listen for NetFlow and export it to Elasticsearch.
  bin/logstash --configtest -f logstash-live-netflow.conf
  bin/logstash -f logstash-live-netflow.conf
If Logstash is installed as a service, the configuration file needs to be copied to the /etc/logstash/conf.d directory and the service restarted:
  cp logstash-live-netflow.conf /etc/logstash/conf.d/logstash/logstash-live-netflow.conf
  sudo service logstash restart
More information about static Logstash configuration files is in the Logstash 1.4.2 tutorial.
Logstash can also be run using the web option that enables both the agent and the Logstash web interface in the same process. Then it can be accessed using h++p://10.0.1.33:9292. We will not be using the Logstash web interface in our deployment.
After running Logstash with the NetFlow config file, if Logstash sees NetFlow records on UDP port 9995 it will store the data in the indices defined in the configuration file. To view statistics about the indices and an index named logstash_netflow5-2014.11.10 in Elasticsearch, you can use
  curl 'localhost:9200/_cat/indices?v'
  curl 'localhost:9200/logstash_netflow5-2014.11.10/_stats'
To delete an index in Elasticsearch named logstash_netflow5-2014.11.10 you can use
curl -XDELETE 'http://localhost:9200/logstash_netflow5-2014.11.10'
3. Elasticsearch index templates
The indices we created before contain information imported from NetFlow. To be able to parse the fields from NetFlow using types that we want, we will use index templates by using the following in the Elasticsearch node:
  curl -XPUT localhost:9200/_template/logstash_netflow5 -d '{
    "template" : "logstash_netflow5-*",
    "settings": {
      "index.refresh_interval": "5s"
    },
    "mappings" : {
      "_default_" : {
        "_all" : {"enabled" : false},
        "properties" : {
          "@version": { "index": "analyzed", "type": "integer" },
          "@timestamp": { "index": "analyzed", "type": "date" },
          "netflow": {
            "dynamic": true,
            "type": "object",
            "properties": {
              "version": { "index": "analyzed", "type": "integer" },
              "flow_seq_num": { "index": "not_analyzed", "type": "long" },
              "engine_type": { "index": "not_analyzed", "type": "integer" },
              "engine_id": { "index": "not_analyzed", "type": "integer" },
              "sampling_algorithm": { "index": "not_analyzed", "type": "integer" },
              "sampling_interval": { "index": "not_analyzed", "type": "integer" },
              "flow_records": { "index": "not_analyzed", "type": "integer" },
              "ipv4_src_addr": { "index": "analyzed", "type": "ip" },
              "ipv4_dst_addr": { "index": "analyzed", "type": "ip" },
              "ipv4_next_hop": { "index": "analyzed", "type": "ip" },
              "input_snmp": { "index": "not_analyzed", "type": "long" },
              "output_snmp": { "index": "not_analyzed", "type": "long" },
              "in_pkts": { "index": "analyzed", "type": "long" },
              "in_bytes": { "index": "analyzed", "type": "long" },
              "first_switched": { "index": "not_analyzed", "type": "date" },
              "last_switched": { "index": "not_analyzed", "type": "date" },
              "l4_src_port": { "index": "analyzed", "type": "long" },
              "l4_dst_port": { "index": "analyzed", "type": "long" },
              "tcp_flags": { "index": "analyzed", "type": "integer" },
              "protocol": { "index": "analyzed", "type": "integer" },
              "src_tos": { "index": "analyzed", "type": "integer" },
              "src_as": { "index": "analyzed", "type": "integer" },
              "dst_as": { "index": "analyzed", "type": "integer" },
              "src_mask": { "index": "analyzed", "type": "integer" },
              "dst_mask": { "index": "analyzed", "type": "integer" }
            }
          }
        }
      }
    }
  }'
The above template tells Elasticsearch that for all indices that start with logstash_netflow5-, every 5s, it should parse the fields according to the types defined in the template and only include the fields of interest to be collected for analysis. For example, the in_bytes and in_pkts are imported as strings by default, and we convert them to long integers that will help us with the Kibana graphs. Also the ipv4_src_addr and ipv4_dst_addr are converted to type: "ip" in Elasticsearch, which is a numeric value that allows easy sorts and range queries (using ip values). Of course, we could keep the default "string" type.
If someone wanted to create a template that includes more fields, for example for NetFlow v9, one could easily put them in the template. To be able to view the fields from a NetFlow record, visit h++p://10.0.1.33:9200/_search?pretty to view the fields of the records and then add them to the template.
To view the Elasticsearch templates, you can use
  curl -XGET localhost:9200/_template?pretty
  curl -XGET localhost:9200/_template/logstash_netflow5?pretty
To delete a template named logstash_netflow5, you can use
curl -XDELETE localhost:9200/_template/logstash_netflow5More information about Elasticsearch index templates is in the Elasticsearch documentation.
Kibana
1. Download and run Kibana as explained in the Kibana installation instructions:
  wget https://download.elasticsearch.org/kibana/kibana/kibana-3.1.1.tar.gz
  tar xvf kibana-3.1.1.tar.gz
2. Kibana configuration
Change the Kibana config file
sudo vi ~/kibana-3.1.1/config.jsby putting in it
elasticsearch: "http://"10.0.1.33",
3. Move Kibana files to the appropriate location in the Ubuntu server web directory
  sudo mkdir -p /var/www/kibana3
  sudo cp -R ~/kibana-3.1.1/* /var/www/kibana3/
Readers should note that every time there are updates in the kibana-3.1.1 directory, files would need to be recopied after cleaning up the directory:
  sudo rm -rf /var/www/kibana3/*
  sudo cp -R ~/kibana-3.1.1/* /var/www/kibana3
4. Install and configure Nginx
Nginx is an open source web server that we use to proxy for Elasticsearch. First let’s install it:
sudo apt-get install nginxThe file /etc/nginx/sites-available/default tells Nginx to proxy request on port 80 to Elasticsearch running on port 9200:
vi /etc/nginx/sites-available/defaultThe file content can be something like
  # If you use this, you'll want to point config.js at
  # http://FQDN:80/ instead of http://FQDN:9200
  #

  upstream elasticsearch {
    server 127.0.0.1:9200;
    keepalive 15;
  }

  server {
    listen *:80 ;
    server_name 10.0.1.33;
    access_log /var/log/nginx/kibana.myhost.org.access.log;

    location / {
      root /var/www/kibana3;
      index index.html index.htm;
      proxy_http_version 1.1;
      proxy_set_header Connection "Keep-Alive";
      proxy_set_header Proxy-Connection "Keep-Alive";
    }

    location ~ ^/_aliases$ {
      proxy_pass http://127.0.0.1:9200;
      proxy_read_timeout 90;
    }
    location ~ ^/.*/_aliases$ {
      proxy_pass http://127.0.0.1:9200;
      proxy_read_timeout 90;
    }
    location ~ ^/_nodes$ {
      proxy_pass http://127.0.0.1:9200;
      proxy_read_timeout 90;
    }
    location ~ ^/.*/_search$ {
      proxy_pass http://127.0.0.1:9200;
      proxy_read_timeout 90;
    }
    location ~ ^/.*/_mapping {
      proxy_pass http://127.0.0.1:9200;
      proxy_read_timeout 90;
    }

    # Password protected endpoints
    location ~ ^/kibana-int/dashboard/.*$ {
      proxy_pass http://127.0.0.1:9200;
      proxy_read_timeout 90;
      limit_except GET {
        proxy_pass http://127.0.0.1:9200;
        auth_basic "Restricted";
        auth_basic_user_file /etc/nginx/conf.d/kibana.myhost.org.htpasswd;
      }
    }
    location ~ ^/kibana-int/temp.*$ {
      proxy_pass http://127.0.0.1:9200;
      proxy_read_timeout 90;
      limit_except GET {
        proxy_pass http://127.0.0.1:9200;
        auth_basic "Restricted";
        auth_basic_user_file /etc/nginx/conf.d/kibana.myhost.org.htpasswd;
      }
    }
  }
In the file, for performance reasons, we made sure there is a persistent connection between Nginx and Elasticsearch using keepalives (upstream and proxy_set directives). The password-protected endpoints ensure that users cannot create and save dashboards without being able to authenticate according to the credentials in the /etc/nginx/conf.d/kibana.myhost.org.htpasswd directory. kibana-int is the default Elasticsearch index to use for storing Kibana-specific objects such as stored dashboards as defined in the Kibana configuration file at ~/kibana-3.1.1/config.js. For more information on Elasticsearch and Nginx, refer to the more tricks with Nginx guide.
If you want to restrict users from seeing certain data, theoretically using index aliases with Nginx could work, but according to Elasticsearch documentation, that will not work easily due to the way Nginx interprets variables in regular expressions. Thus, someone would need to use complicated rewrites (explained here) or use a different proxy, not Nginx.
Also make sure that the Kibana configuration file ~/kibana-3.1.1/config.j that you edited earlier still points to Elasticsearch on port 80, which Nginx will proxy and not the default 9200.
elasticsearch: "http://10.0.1.33",
Then let’s create the file with the credentials for user authentication in Kibana’s default kibana-int index mentioned above. Use htppasswd of apache2-utils (after installing it) to configure a username usernameX and a password that will be able to make changes to Kibana like creating and saving dashboards:
  sudo apt-get install apache2-utils
  sudo cp nginx.conf /etc/nginx/sites-available/default
  sudo htpasswd -c /etc/nginx/conf.d/kibana.myhost.org.htpasswd usernameX
    < ...password creating and confirmation... >
5. Restart Nginx after making all the changes:
sudo service nginx restart
6. Kibana web interface
For our exercise we wanted to use Kibana to view top destinations and ports with most traffic, the protocols that use the most traffic and a traffic graph. Of course, there are many more graphs that could be produced in Kibana.
Before using the Kibana web interface, make sure Elasticsearch is running and potentially that Logstash is also running and importing data in Elasticsearch as shown in the steps above. Note that the collected data might take a few minutes to show in Kibana.
Visit h++p://10.0.1.33. Kibana comes with some preinstalled dashboards to use with Logstash, for example, h++p://10.0.1.33/index.html#/dashboard/file/logstash.json. Of course, administrators can edit and create new dashboards. Dynamic scripted dashboards (.js) are also possible. Here we will only show a couple of panels we used to demonstrate the NetFlow data collected.
To be able to only see specific NetFlow data stored in the Elasticsearch index we created later, start from the h++p://10.0.1.33/index.html#/dashboard/file/logstash.json dashboard and change the dashboard setting by clicking the Configure Dashboard icon at the top right and set the Index tab to have an Index Pattern of [logstash_netflow5-]YYYY.MM.DD and Timestamp value of day.
To filter the data shown in Kibana’s dashboards, we can use filters or queries. For example, to only view information about FTP’s control channel (TCP port 21) we can use a querystring of netflow.l4_dst_port:21. Similarly, we can use a filter or query with netflow.protocol:17 to only process UDP flow information. Finally, a filter with Field: netflow.ipv4_dst_addr and Value: 10.0.1.21 will filter on flows that were only destined to 10.0.1.21.
For more information on filters and queries, refer to the queries and filters documentation.
Now we can see the top destinations and top destination ports based on the bytes sent. We create a table panel with the Inspect checkbox checked, with Term Mode: terms_ stats, Stats type: total, Field: netflow.ipv4_dst_addr and Value Field: netflow.in_bytes. The Style is pie. Similarly, we can do the same for destination ports. We create an able panel with the Inspect checkbox checked, with Term Mode: terms_ stats, Stats type: total, Field: netflow.ipv4_dst_port and Value Field: netflow.in_bytes. The Style is pie. These two pie charts show which destinations and ports have seen the most data:
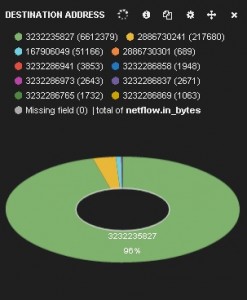
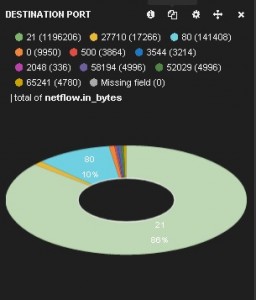
We can see that the destination addresses are shown as numbers. That is because the Elasticsearch index template we created earlier treats the NetFlow source and destination address fields as type: "ip" and thus converts them to a sortable number. Queries and filters can still use the addresses, as we will see below. Administrators could, of course, choose to treat the addresses as strings, but that would affect sortability and querying and filtering performance.
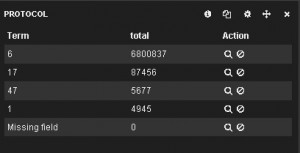
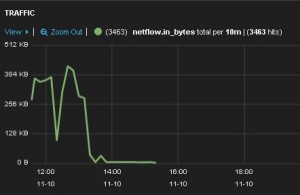
Now we can create a top protocols table and traffic-over-time chart. First we create a table panel with the Inspect checkbox checked, with Term Mode: terms_ stats, Stats type: total, Field: netflow.protocol and Value Field: netflow.in_bytes. The Style is table. Then we create a histogram panel with the Inspect checkbox checked, with Chart Value: total, Value Field: netflow.in_bytes and the Auto-interval checkbox checked. The top protocols table and the traffic-over-time chart are shown below.
The whole dashboard can be found here. Of course, Kibana offers many more panels and features that can be added in a dashboard. The dashboard that contains all these panels can be saved and reused after being prompted to use the htpasswd created earlier. Then it can be accessed using h++p://10.0.1.33/index.html#/dashboard/elasticsearch/<dashboard_name>. The dashboard can also be exported and saved in the Kibana-3.1.1/app/dashboards/ directory as a json file and then copied into the /var/www/kibana3/app/dashboards/ directory. Afterward it can be accessed using h++p://10.0.1.33/index.html#/dashboard/file/<dashboard filename>.json.
For more information on rows, panels and dashboards, refer to the rows and panels and saving and loading documentation.
In conclusion, ELK is a set of very useful, open source analytics tools. We just saw how to set them up from scratch to consume NetFlow. Their capabilities are endless. It is up to the user to explore them…
Note: Readers should note that a prepackaged ELK stack can be downloaded in Vagrant. Someone using Vagrant would avoid taking all the steps to install and configure the ELK components, but would have less control and knowledge of how the ELK tools work together. For more information, refer to the Vagrant post.


FYI the images on this appear to be broken and you have a few instances of “h++p” instead of http.
It’d also be awesome if you could post the dashboard json for people to quick load 😀
Hi Mark,
We fixed the images issue. the “++” is the links is for HTML to not automatically link to a page in an internal server (10.0.1.33) that does not exist. I linked the dashboard in the blog as you suggested. It is at http://blogs.cisco.com/wp-content/uploads/Kibana-dashboard.txt
Thank you for the feedback.
Panos
Hi there,
having tried the netflow plugin, we were only able to establish a few hours before it crashed. This was on a 24core box with oodles of memory. Have you tried this plugin for monitoring +5Gb/s on a port flow monitoring?
Thanks,
Phil.
Hi Phil,
My rate in the lab we about 30 devices sending about 4 flow records each per second. So, about 120 total records per second and I didn’t see Logstash act up. I am not sure about the rate that your Netflow exporter is sending, but probably it is much more. Also, I can’t be sure if Logstash crashes due to overload. If Logstash crashes for you consistently maybe you can check their mailing list http://www.elasticsearch.com/community/ I am sorry I couldn’t help more.
Panos
Panos,
Great post. I’ve been looking for a good open source solution for Netflow analysis for years. None of the ones that existed really covered what I like. ELK stack looks like a winner.
You post is great tutorial, better than many out there on the wild. It would be nice if you could do follow ups regarding ELK, for netflow or network monitoring / troubleshooting in general
Thank you for the comment Jose.
ELK is indeed a pretty useful open-source tool. The are other commercial and a few open-source ones that can do the job of course.
As you are suggesting, we will try to blog for ELK with Netflow lessons learned from our infrastructure.
Panos