
In the 2016 U.S. Presidential Election, we witnessed the stunning and unexpected defeat of a methodology in addition to a candidate: poll-based election predictions. November 8, 2016 was a spectacular failure of poll-based predictions, fast on the heels of the spectacular failure of the poll-based predictions in the 2015 U.K. General Election.
Since we have published a new big data forecast as part of the Cisco Global Cloud Index, I had to ask myself… did the big data election forecasts do any better? I was surprised to find that there weren’t any publicly released big data election forecasts. Polls are not big data. Poll-based forecasts are also not data science (often used interchangeably with big data), since a true data science approach would not assume beforehand that only one type of data has predictive power. There may be big data forecasts in existence, possibly done by BlueLabs and Cambridge Analytica, the two firms responsible for microtargeting for each of the campaigns. But these models, if they do exist, are proprietary. All public state-by-state election forecasts were based almost exclusively on polling data, with few exceptions.
In an era when people are plastering social media with their inner thoughts on a daily basis, the idea that you can only know how people will vote by calling them up and asking them does seem a little old-fashioned. If a retailer can figure out you’re pregnant before you’ve told anyone (so they can recommend products you’ll need for the baby in advance), guessing someone’s voting intentions does not seem out of reach. We are in the middle of a big data boom, but there seems to be little sign of it in the world of political predictions. The methodology for how to incorporate the vast amounts of data now available is poorly understood, it’s true, but clearly there is space for experimentation given how poorly most of the forecasts fared in this election.
The matrix below shows most of the major predictions for states where the final outcome was not anticipated.
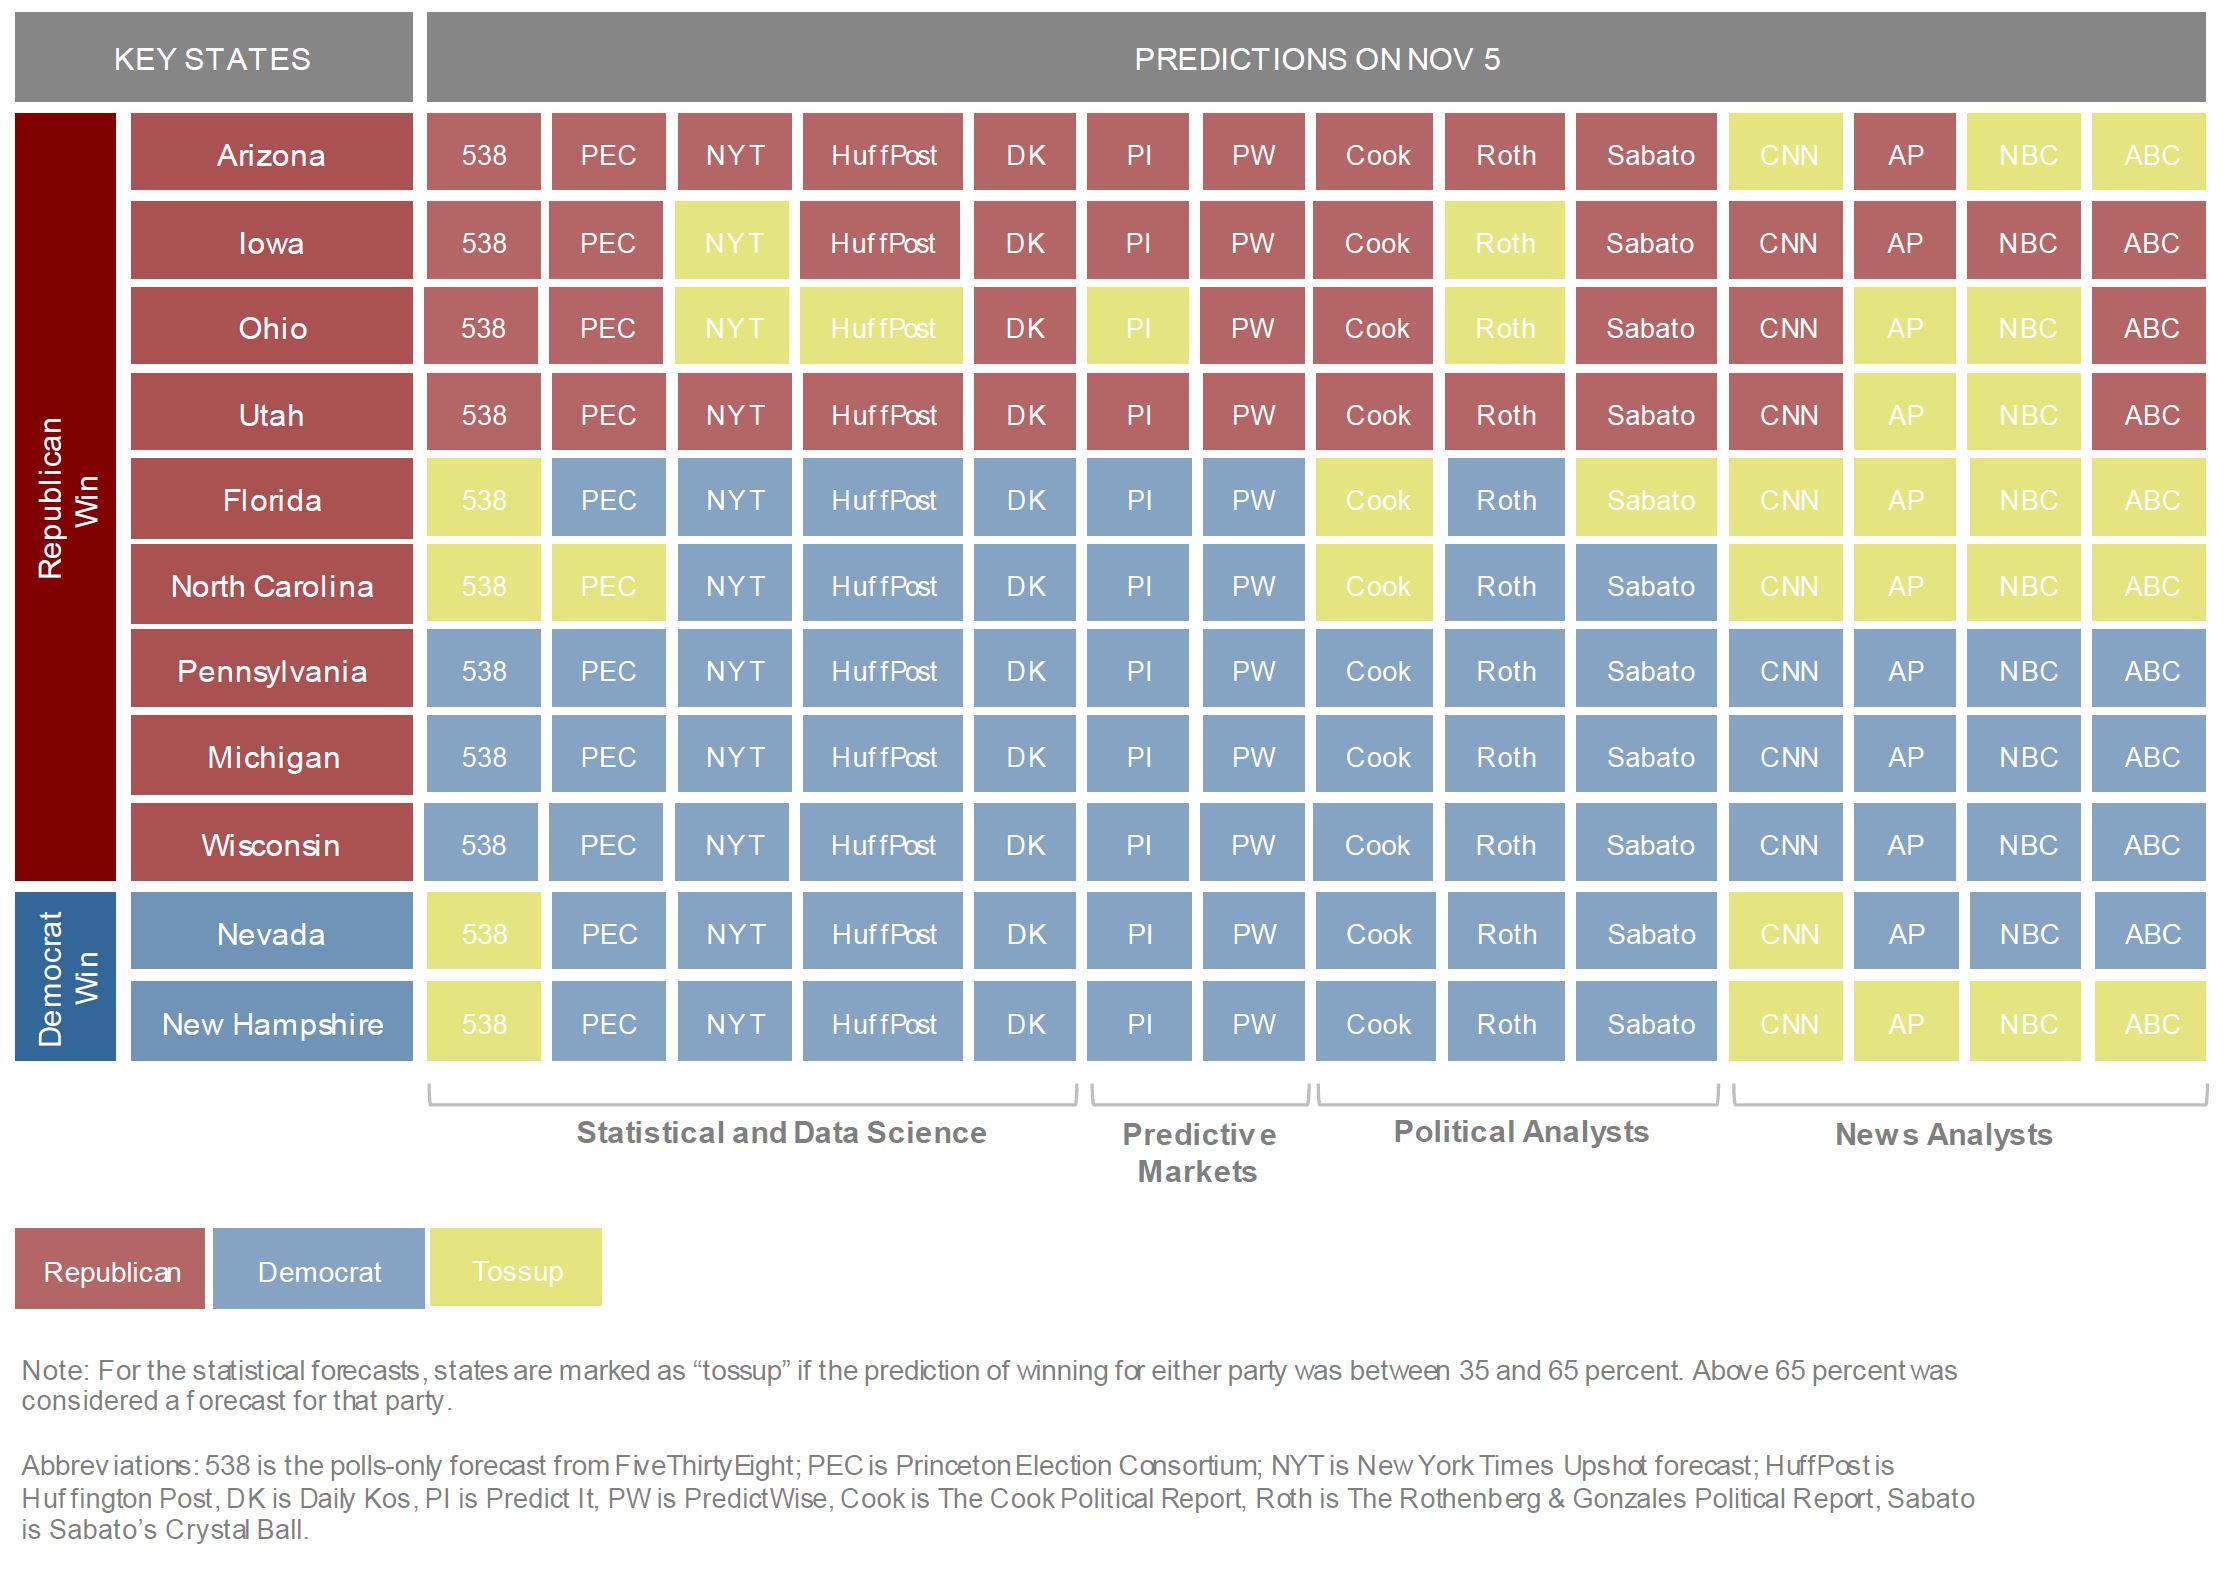
The big blocks of blue for states that ultimately went red is striking. None of the 14 forecasts covered here expected the results we saw in Pennsylvania, Michigan, and Wisconsin. None even tagged those states as tossups. Florida and North Carolina were seen as tossups by several forecasters, but there’s still a lot of blue from others and a conspicuous absence of red.
How did the overall electoral vote projections from these organizations compare to the actual results? See the graphic below, which makes projections comparable by eliminating “tossup” wild cards. (See the notes in the graphic for details on how this was done.)
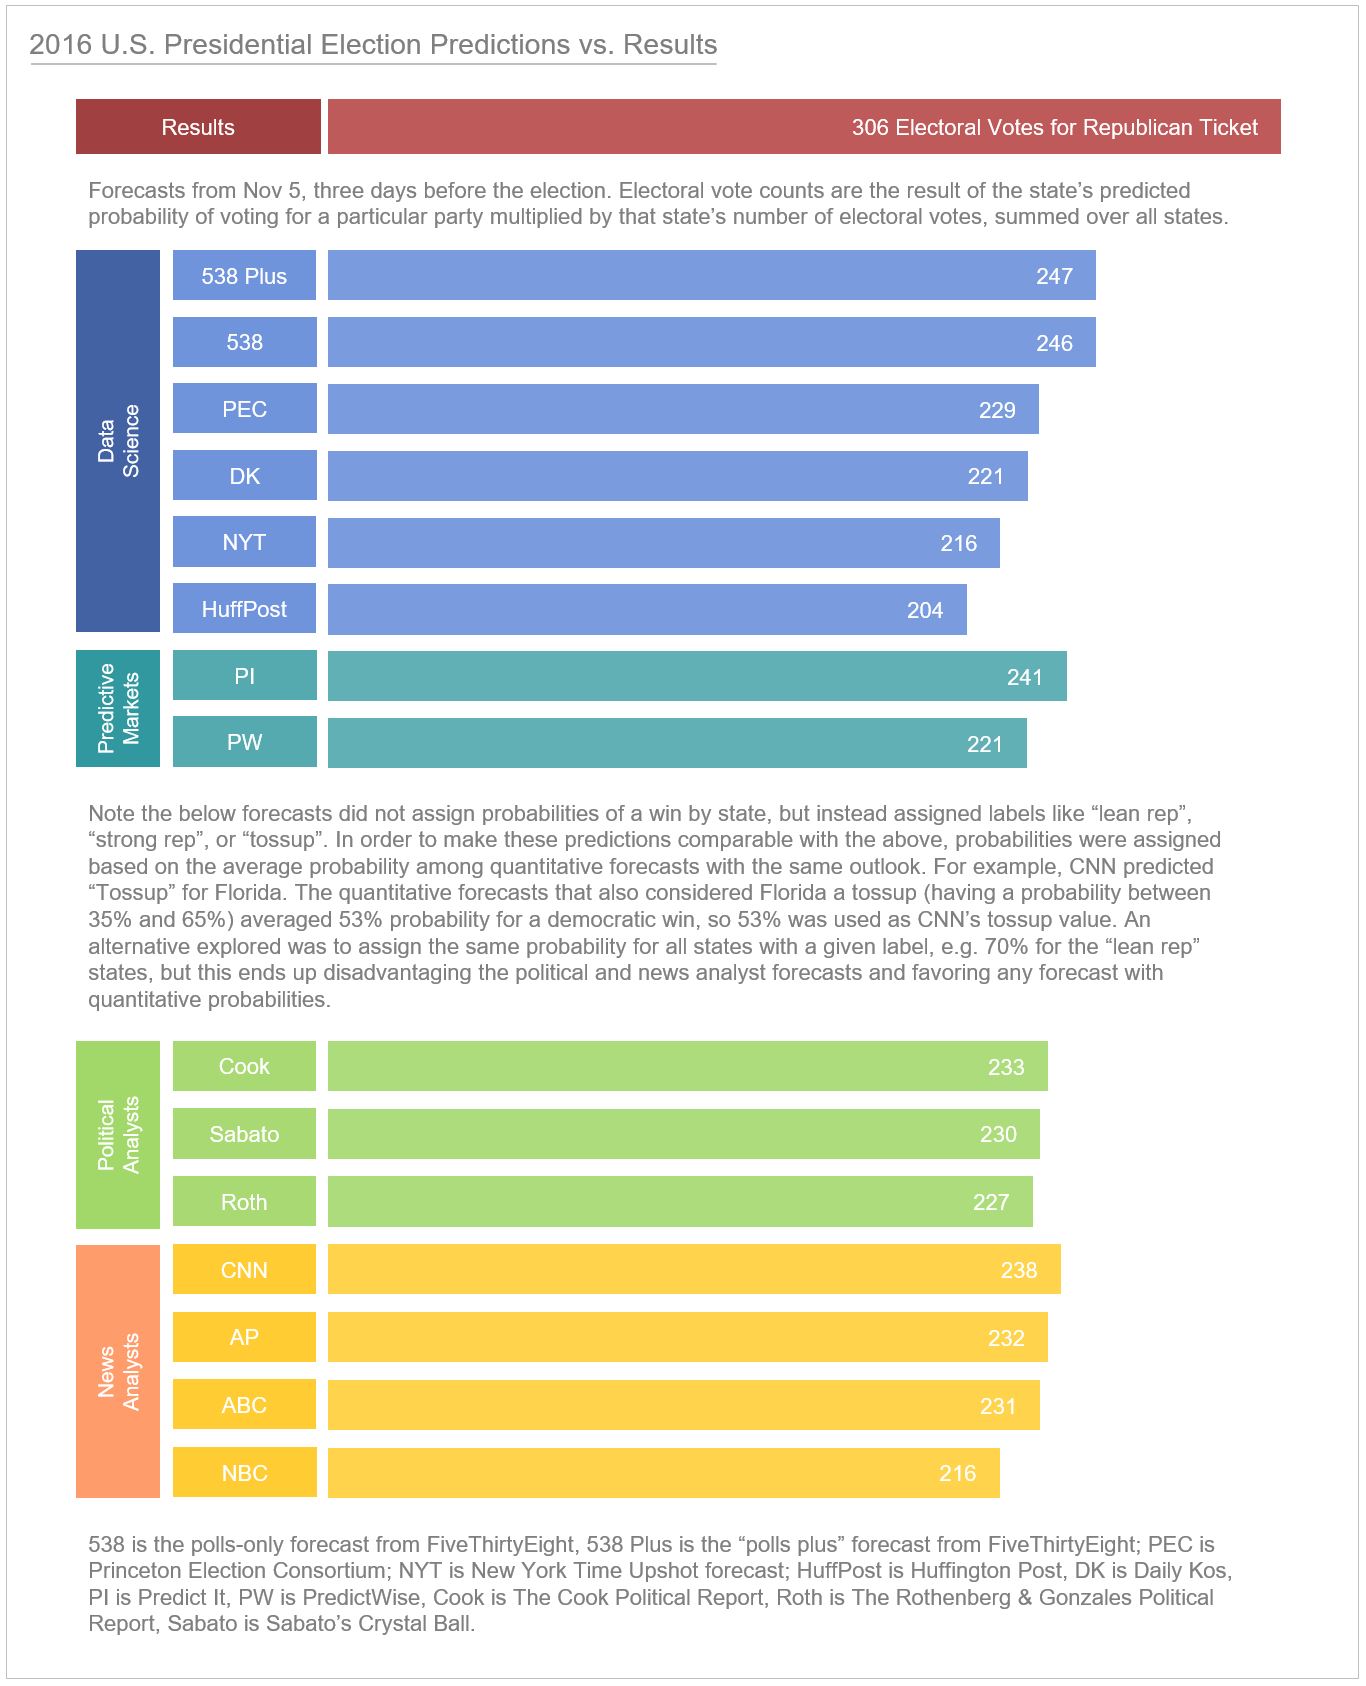
The closest projection came from Nate Silver’s FiveThirtyEight “Polls Plus” model, followed closely by the FiveThirtyEight “Polls Only” model, followed by the results from PredictIt, which tended to follow the FiveThirtyEight data. The FiveThirtyEight “Polls Plus” model is one of the few to incorporate non-polling data in the form of an economic index, and the economic data indicated this would be a tight race. The “Polls Only” model incorporates the historical accuracy of polling data, and also takes into account the connections between state results so that the probabilities of a win in one state are not independent of those in another.
While the FiveThirtyEight model was vindicated as the most accurate poll-centric forecast for this election, the bottom line is that all the forecasts missed, by a significant margin. And all forecasts were lower than the actual result. This is a red flag that something is wrong – ideally we would have some over and some under the final result. To me, it indicates that the data underlying the forecasts was bad, not that the forecast methodologies were faulty. The main problem with the forecast methodologies are that they relied almost exclusively on polling data.
What is the problem with polling? Polls seem increasingly unable to accurately capture the demographic that ends up voting. There are a few reasons for this:
- The difficulty of random sampling by phone. Due to the decline in landline phones and the inability (by law) of pollsters to autodial cell phones, it is difficult to reach mobile users, and landline users may no longer be a good base for random sampling. Response rates for phone polling have declined over time, which has contributed to the inability to get a good sample with this method.
- The difficulty of representative sampling via the internet. As explained in a 2015 NYT article by Cliff Zukin, the methodology for getting a representative sample with online polling is still poorly understood.
- Mischaracterization of “likely voters”. In this election, there may have been a higher than expected turnout of demographic sub-groups that haven’t been frequent voters in the past, as suggested by Cambridge Analytica in a Wired article. It’s easy for polls to miss subgroups of new or infrequent voters. Weighting to capture subgroups is likely what led the USC/L.A. Times Daybreak poll to have results that most accurately reflected what happened on election day.
With the discussion above, it appears we can make further progress in improving the polling data that is used by the forecasters.
What about predictive markets? In theory, predictive markets are supposed to be good at capturing multiple variables through a “wisdom of the crowds” effect where well-informed participants wager on certain outcomes in a market-like setting. In this case, however, the PredictIt and PredictWise predictions appeared just to mimic the statistical forecasts. I asked Paul Held, one of the top predictors to come out of the Good Judgement Project (one of the best-known predictive market projects), why this might be. He explained that the number of participants in each forecast is legally capped so there is not enough of a “crowd” to capture many of the nuances that would bring to a question. What’s more, the value of bets is legally capped, so the markets are not very liquid. According to Held, “any market that doesn’t have high liquidity is going to be less efficient at processing information. Since regulatory rules on predictive markets limit the number of traders and the amount they can venture, the closer you get to an election the less liquidity you see in those markets.”
The conclusion I’ve come to about poll-based forecasts is that while statistical methods such as those used by the FiveThirtyEight group and others have done an impressive job in interpreting the data from polls, the data itself is flawed, as is the reliance only on poll data. Big data is not the answer to every problem, but in this case it can be used to identify other relevant variables that can be used in predictive models, so that forecasters have multiple lenses on the voting population rather than just one.
Maybe in four years we’ll have an election in which there are viable big data forecast contenders. I hope that firms with proprietary data science or big data election predictions will start to make those public. I hope that the new generation of data scientists will start experimenting with new machine learning models to anticipate election results.
For now, without a big data forecast, we will have to settle for a forecast of big data, which is a new feature of our Global Cloud Index. We are expecting big data volumes (bytes) to multiply 10-fold by 2020. See the Global Cloud Index page for more details on this forecast, along with our forecasts for datacenter and cloud traffic, datacenter and cloud workloads, SaaS/PaaS/IaaS, hyperscale data centers and hyperscale traffic, storage capacity and total data stored, and the cloud readiness of countries across the globe.
Join our conversation on Twitter through #CiscoGCI.


I think the added element of a deep pocket of new voters made prediction less reliable this cycle. Also, I noticed lots of anecdotal evidence that voters were keeping their opinions to themselves this time. Good read!
adidas Yeezy Boost 350 “Moonrock”” view all 173 items on ebayVIEW ITEM$116.
ultra boost shoes white http://cimorelli.com/acquisti.asp?p_id=ultra-boost-shoes-white-759844