This blog was written by Annika Mammen, former User Experience Engineer at Cisco
There are so many areas to consider when dealing with protecting and detecting threats, unfortunately cognitive overload is one problem that is often overlooked. Remember when search engines had a million news articles, reading suggestions, and market analysis on the home page. Users had to sift through the mountain of information and decide what was the best source for them. This is a prime example of cognitive overload, and this is something most SOC analysts know too well. Too many options and complex steps make users feel frustrated and confused. Their brain is being given too much information to process and gets overwhelmed. When Google came on the scene with a single search bar, users flocked to it because it changed the game. It helped organize data and surfaced up the most relevant pieces of information. The single search bar on the page made it very easy for users to understand what they had to do. A clean results page made it abundantly clear which links were most important. Finally, very few prominent buttons on the page made it easy to know what the next step was.
The same concepts and problems appear in the security space, frustrating SOC analysts and making their jobs much harder. They deal with having too much information, too many choices and no real way to organize the data to help users make better data-driven decisions. To have the best user experience possible, designers leverage a technique called progressive disclosure. It is a pattern used to break down the information into bite sized pieces and feed it to the user as and when needed. A good example of this in everyday life is the average ATM. The first screen just shows a few options like withdraw, deposit, and check account balances. Within seconds, you understand what action you must take to deposit your money. Once you choose an option, it takes you to the next bite sized step. Easy!
Similarly, the security world is filled with alerts, metrics, targets, etc. It is easy to fall into the cognitive overload trap. Cisco XDR uses progressive disclosure to help reduce that cognitive load, support novice and expert users, and help users to focus on high priority incidents and remediate quickly. Now, let us look at how we achieve that.
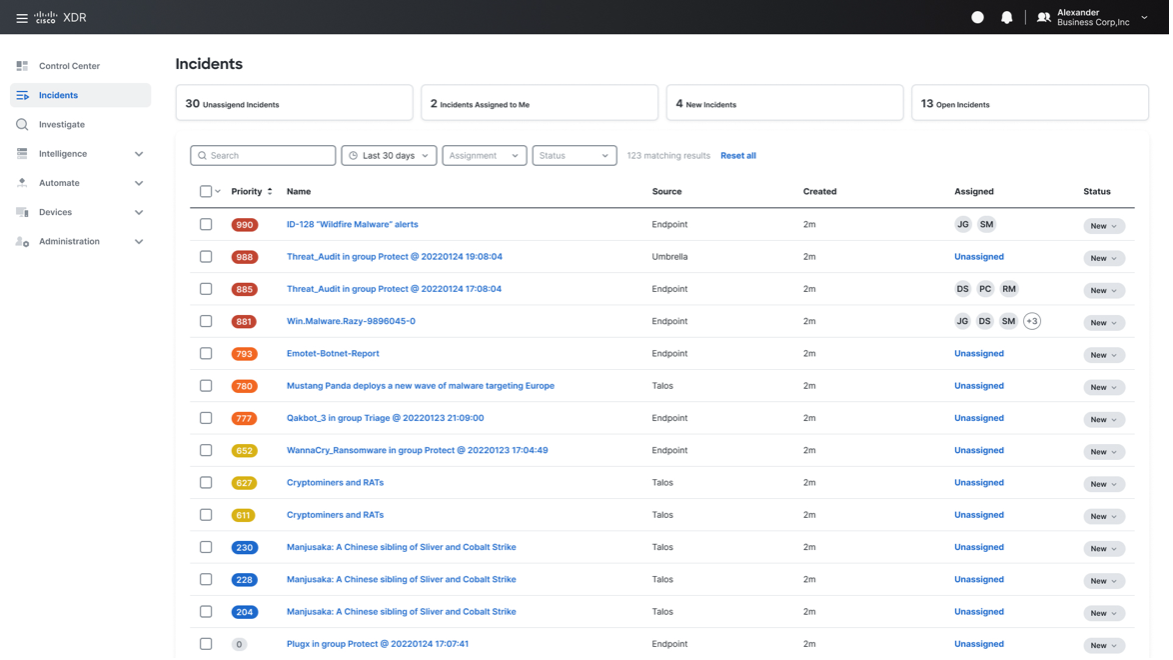
1. Risk Score
Incidents are ranked based on a color-coded risk score. Immediately the user’s focus is drawn to the high priority incidents that are marked with a red coded score. Novice users who are not familiar with the scoring method can hover over the score and see a popup with an explanation.
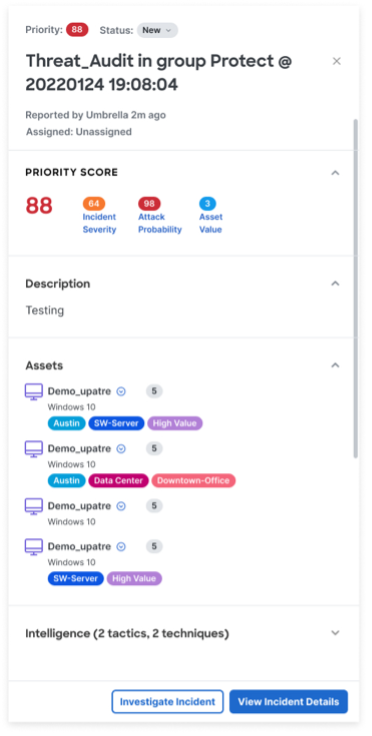
2. View Incident Details
Once an incident is selected, a drawer opens on the side. This provides a high-level overview of the incident. In a single glance the user can see the incident status, assignees, description, breakdown of risk score, and assets. The user can assess if this incident must be prioritized without having to leave the page. For further details, they can click on ‘View Incident Details’ to load a detailed page of the incidents.
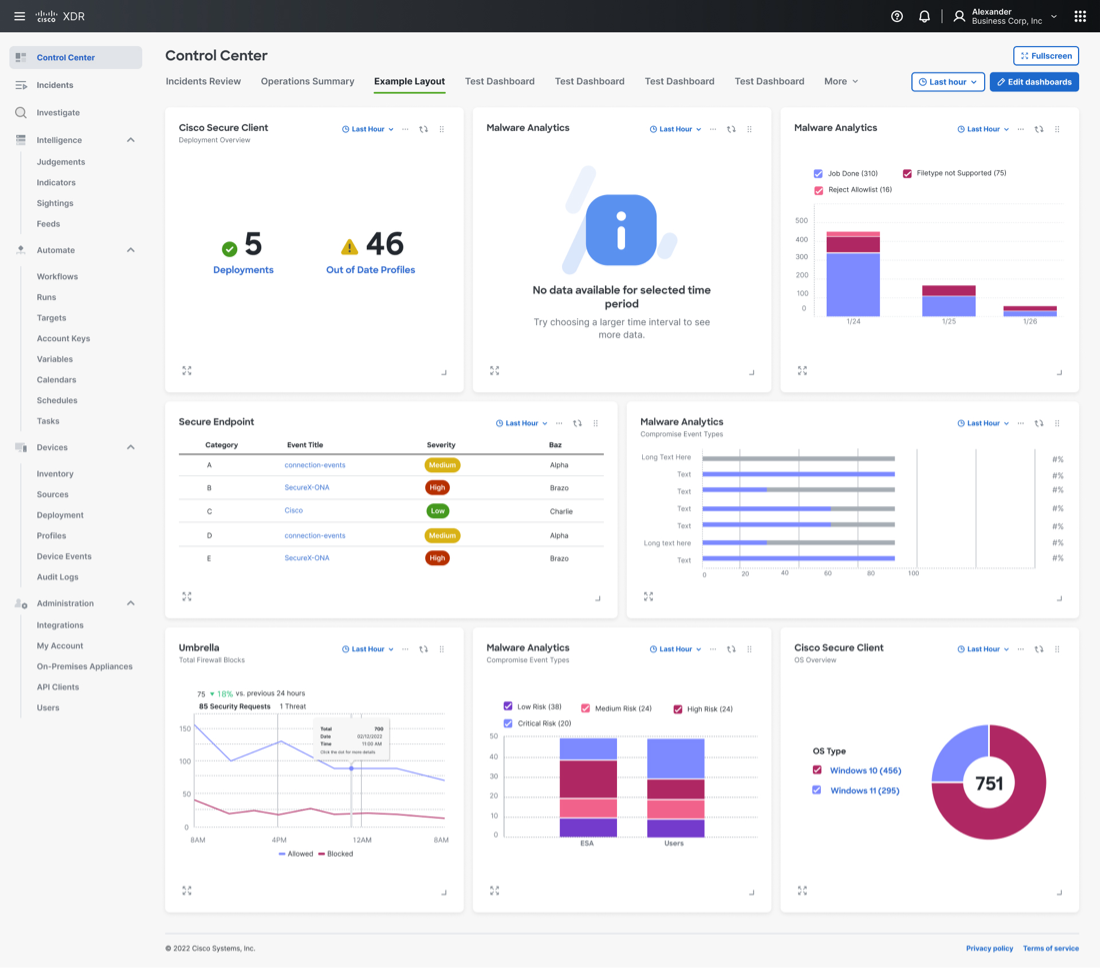
3. Control Center Tiles
The tiles displayed on the control center give a high-level overview of key metrics to better understand the health of the system without being too granular on the details. A user can create new dashboards or edit existing ones. This also helps the user see patterns and focus on areas that need to be prioritized.
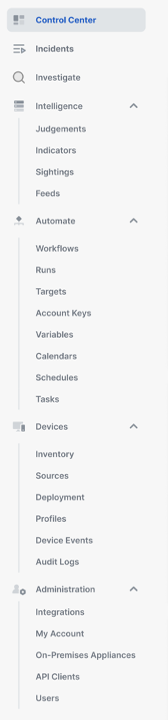
4. Navigation Menu
Often, the overwhelming amount of information and actions that can be taken are spread across numerous screens. It can be easy for analysts to get lost in the maze. With Cisco XDR, we have grouped actions into 7 main categories, which are further broken down into 26 subcategories. We progressively take the user deeper into the product to get them to where they want to go.
5. Investigate Node Map
Mapping out an incident can sometimes look like a map of the Labyrinth. Files, assets, and IP addresses, to name a few, connected with numerous lines can be hard to decipher. Classic cognitive overload problem. XDR has grouped these so only key nodes are displayed in the map. On hover, each key node will expand to show more nodes and the lines connecting them will display more information on the relationship between each node. Clicking on a node will bring up a popup that displays options for further investigation.
Cisco XDR was built by SOC practitioners, for SOC practitioners, and lays out information in a consistent and easy to follow format – first a summary view of the data, then users can drill down to a detailed view of that same data, and finally if necessary (or out of pure interest and curiosity!) users can drill down again to see the raw data view. Using progressive disclosure and this consistent display of information, Cisco XDR helps SOC analysts view the information they need to move forward and take next steps to effectively mitigate threats. No more analysis paralysis, only data-based decisions here!
Visit our XDR product page.
We’d love to hear what you think. Ask a Question, Comment Below, and Stay Connected with Cisco Secure on social!
Cisco Secure Social Channels