
Back in April, I wrote a blog post about the new version of the Common Vulnerability Scoring System (CVSS). The changes made for CVSSv3 addressed some of the challenges that existed in CVSSv2. For example, CVSSv3 analyzes the scope of a vulnerability and identifies the privileges an attacker needs to exploit it. The CVSSv3 enhancements allow vendors to better analyze security vulnerability impact. The changes in CVSSv3 also help our customers more easily determine the urgency with which they need to respond to vulnerabilities
In my previous blog post, I shared the details of a study that analyzed the differences between CVSSv2 and CVSSv3 scores using scores provided by the National Vulnerability Database (NVD). I have continued to monitor the way vulnerabilities are scored using the new version of CVSS because Cisco will soon begin supporting the new version. In my previous study, back in April, I analyzed 745 vulnerabilities. I recently expanded the data set and this new analysis includes a total of 3862 vulnerabilities. I kept the scores and data vendor neutral and used only NVD’s CVSSv2 and CVSSv3 scores.
CVSSv3 Metrics
If you are not familiar with the CVSS metrics, you can read the CVSSv3 specification at FIRST’s website: https://www.first.org/cvss/specification-document. You can also use the CVSSv3 calculator: https://www.first.org/cvss/calculator/3.0
FIRST has also published several examples of CVSSv2 vs. CVSSv3 scores at: https://www.first.org/cvss/examples
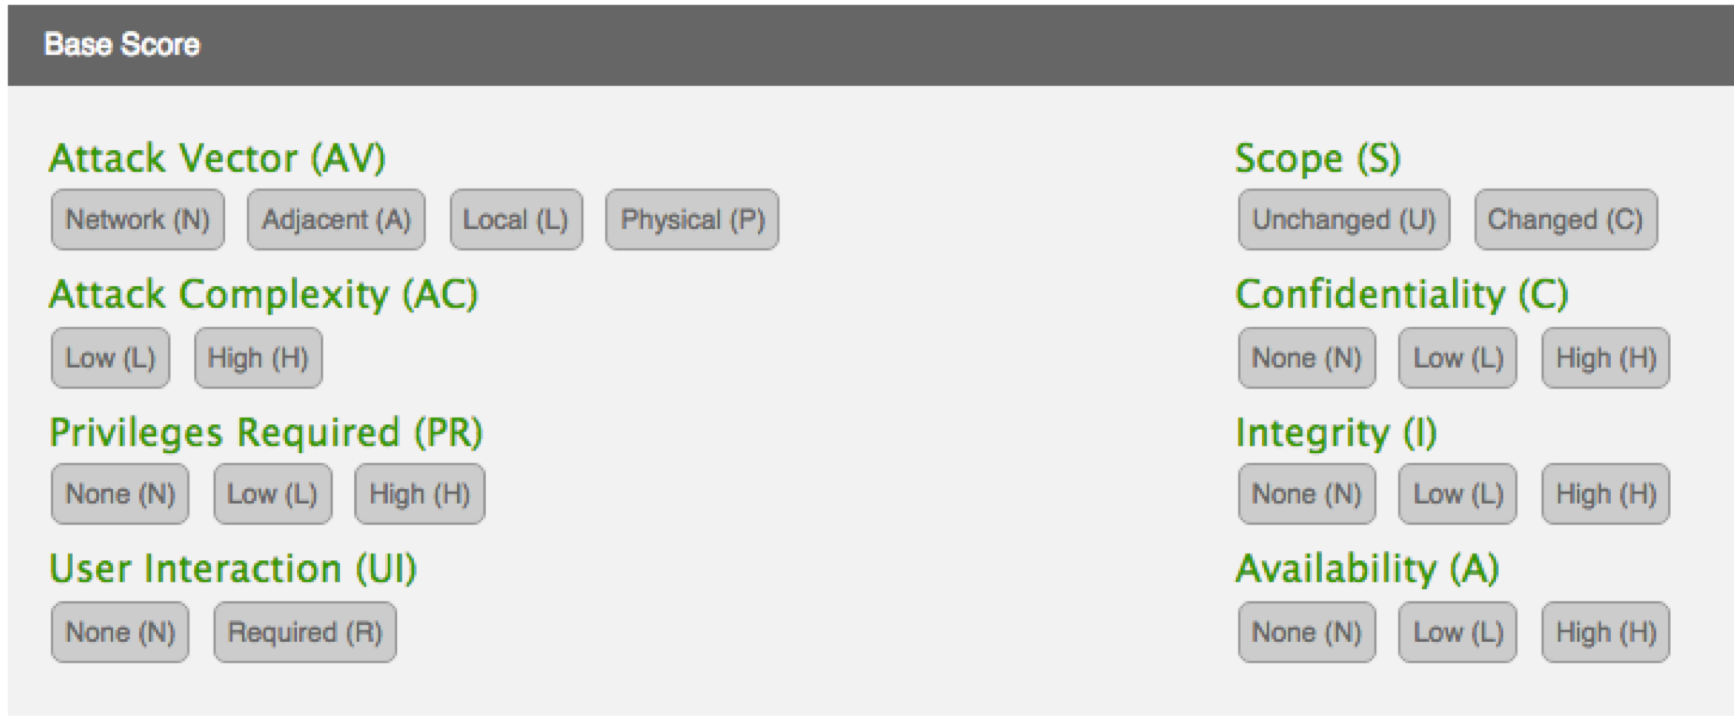
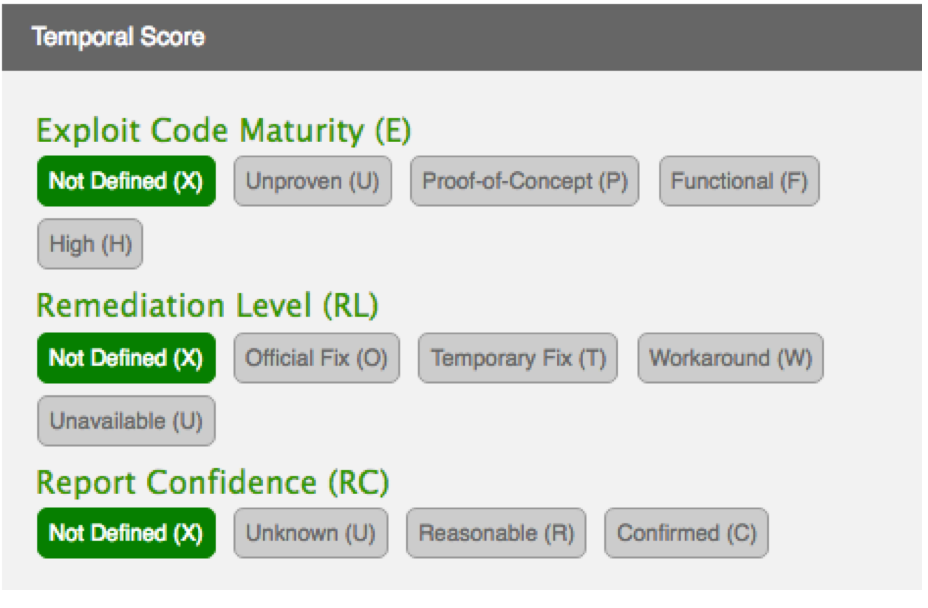
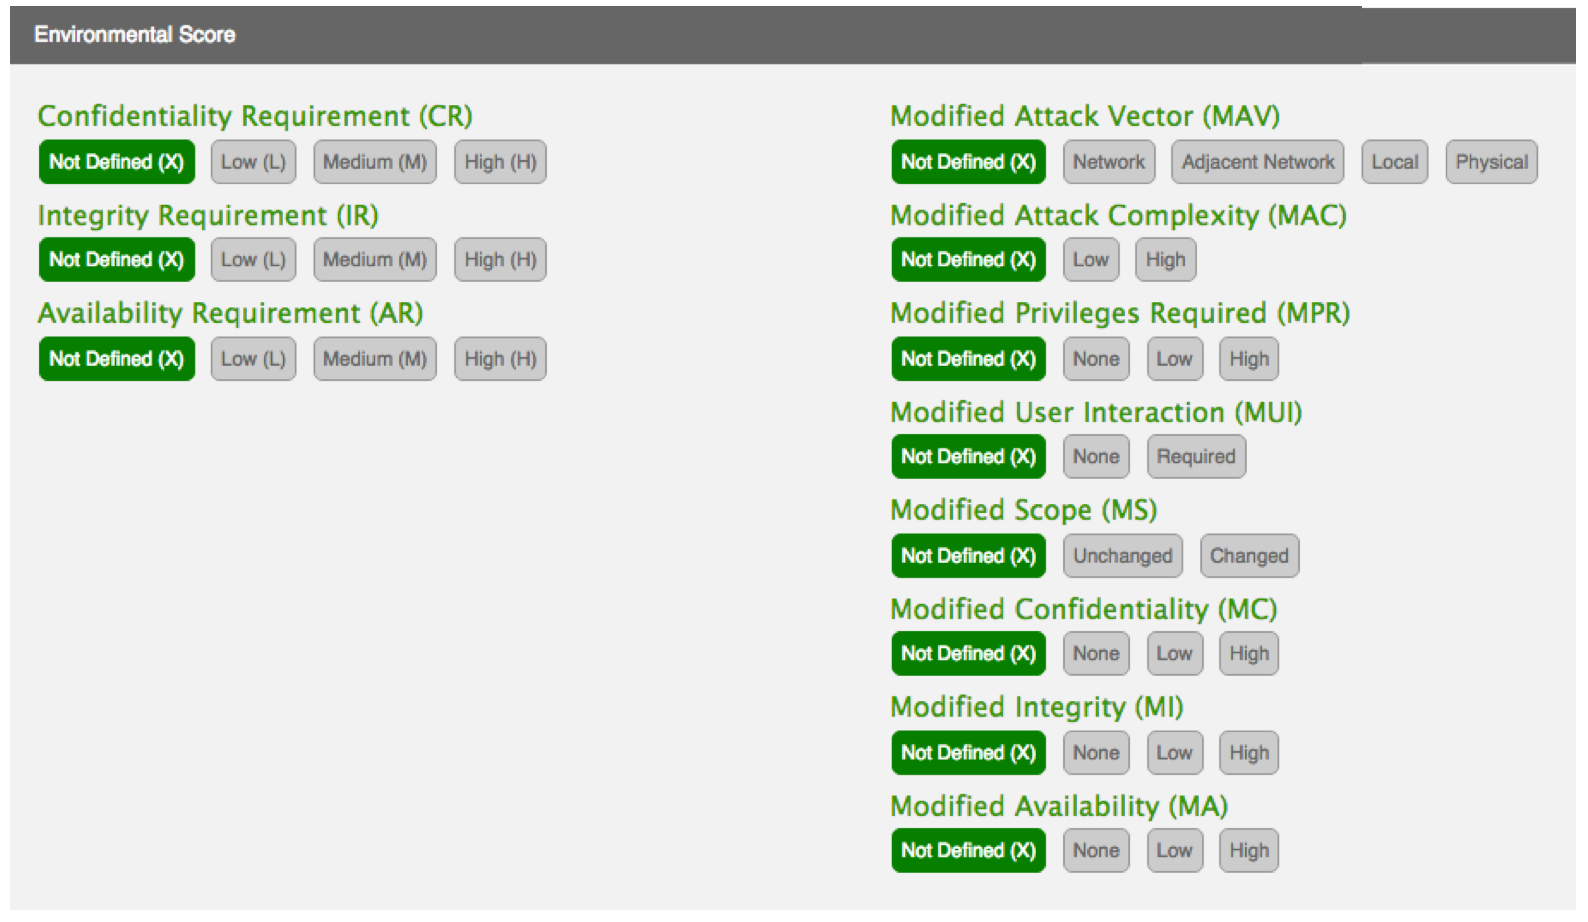
I have included screenshots of the Base, Temporal, and Environmental metrics from FIRST below for your reference.
Study Results
The total number of vulnerabilities studied was 3862. These were vulnerabilities disclosed from January 1, 2016 thru October 6, 2016 and the source of the data is NVD.
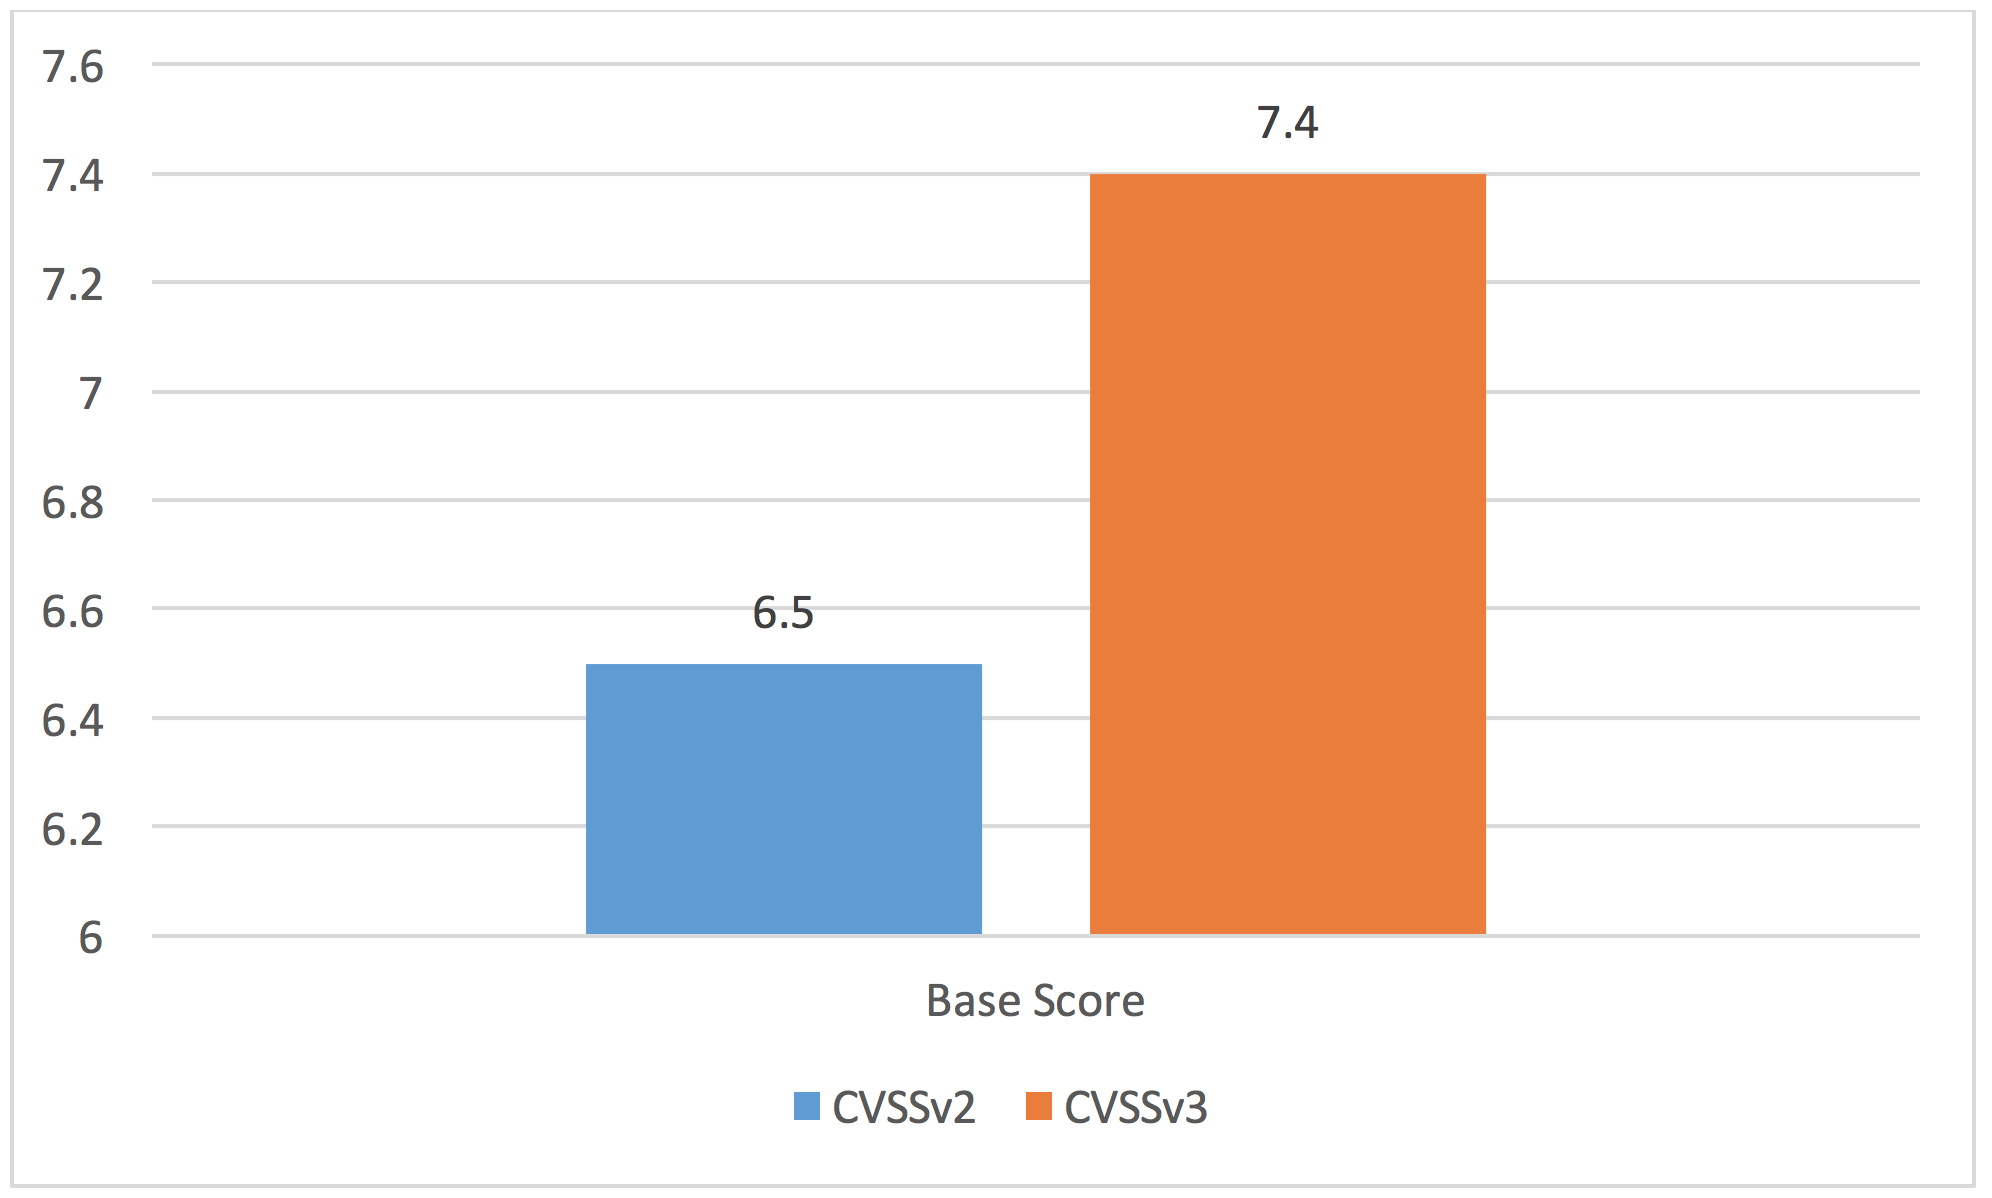
The average base score increased from 6.5 (CVSSv2) to 7.4 (CVSSv3). This is illustrated in Figure 4.
Cisco adopted a Security Impact Rating (SIR) in 2015, which uses basically the same scale as the CVSSv3 qualitative severity rating scale. This was done to help organizations properly assess and prioritize their vulnerability management processes.
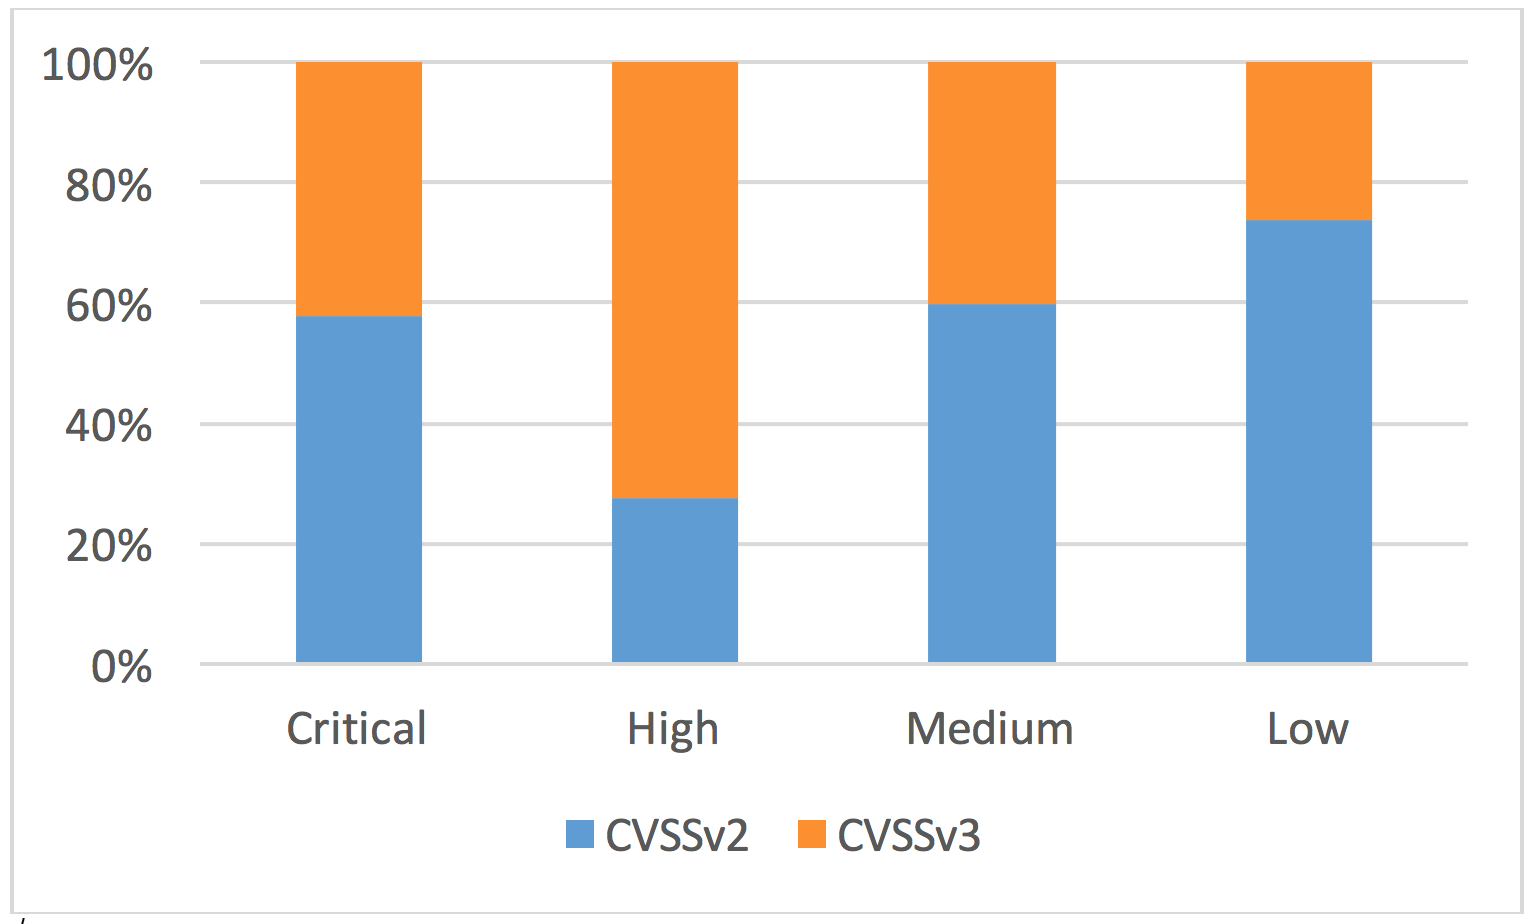
Figures 5 and 6 include high-level statistics for the qualitative severity differences between CVSSv2 and CVSSv3 scores for the vulnerabilities assessed in this study.
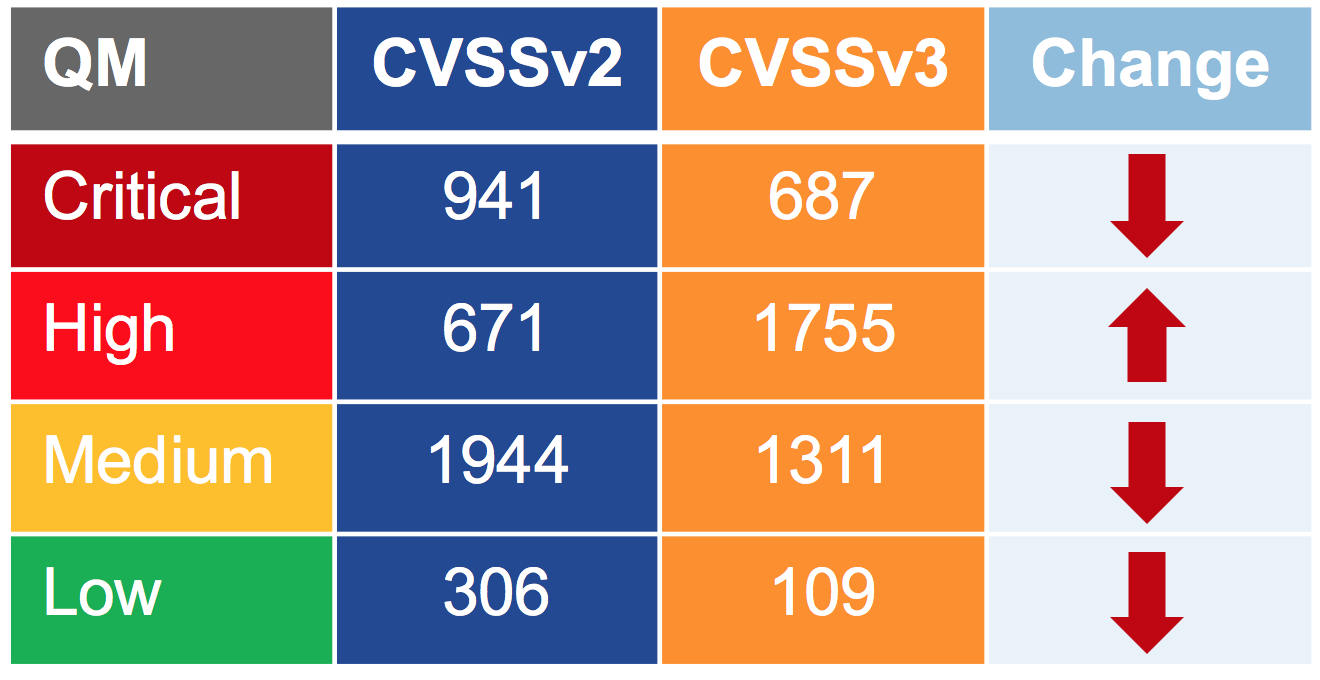
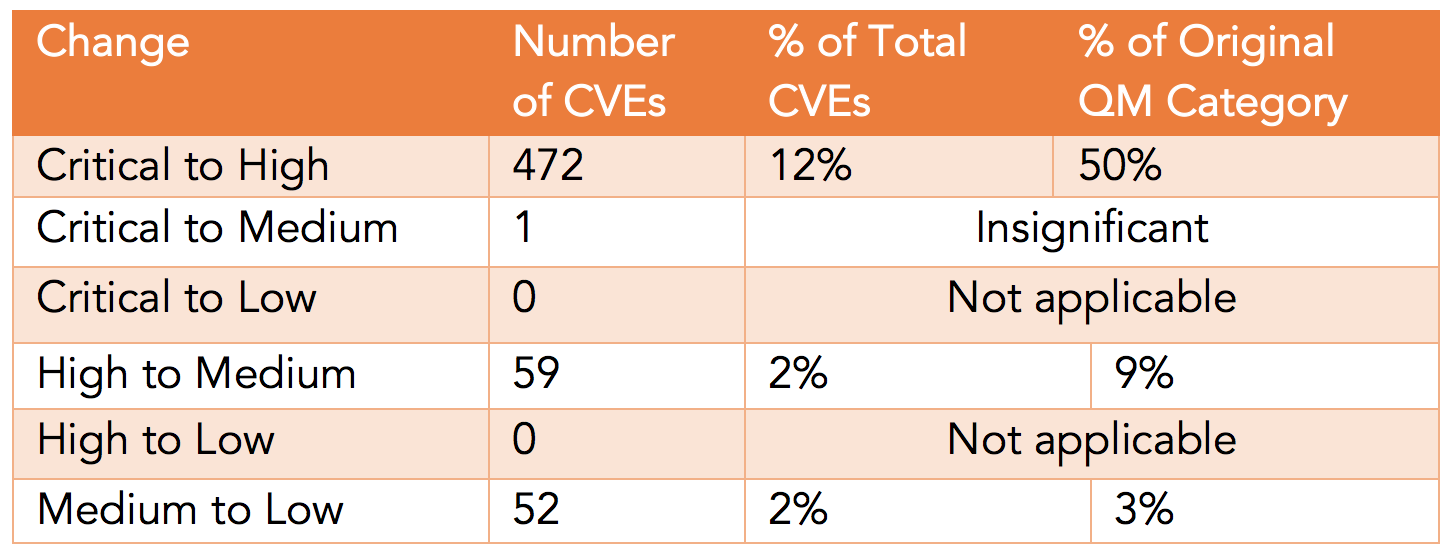
There were several vulnerabilities whose base score decreased from a higher to a lower QM category when scored with CVSSv3. The following table depicts vulnerabilities for which the QM category increased (not just the score) when going from CVSSv2 to CVSSv3.
However, there were far more vulnerabilities whose CVSSv2 base score increased when scored with CVSSv3.
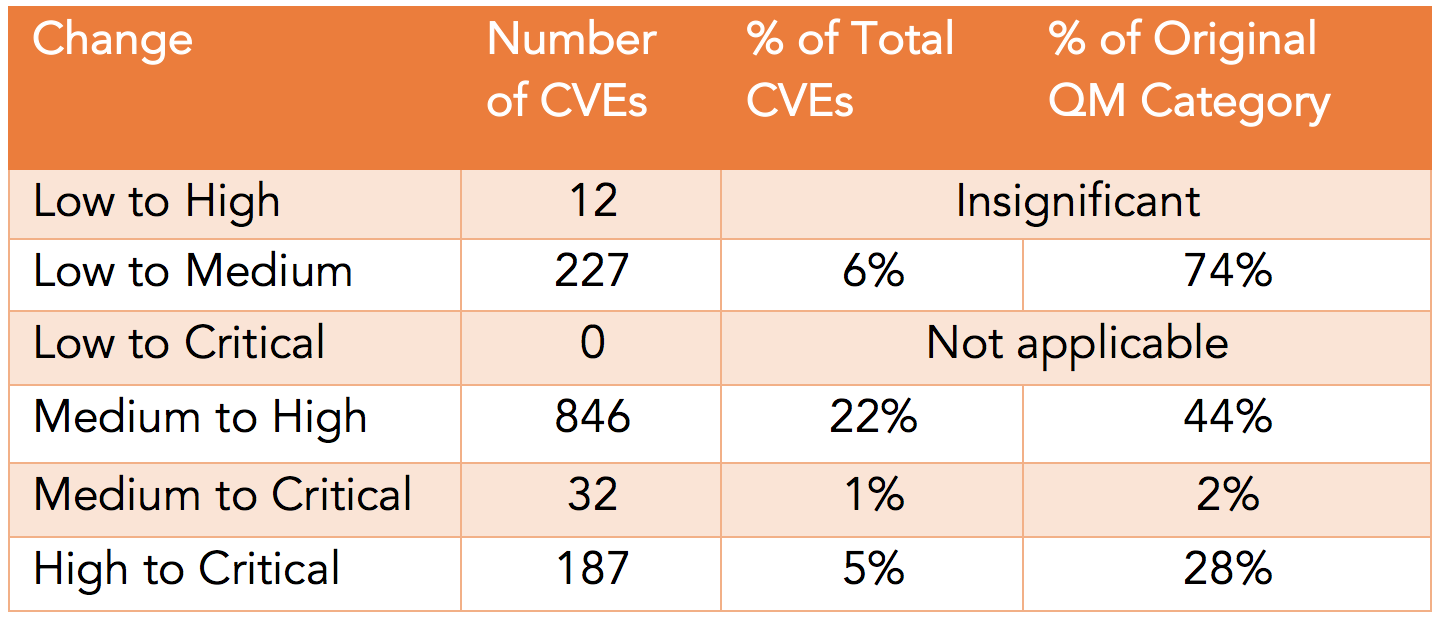
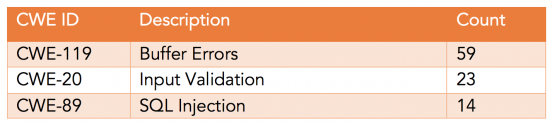
Seventy-four percent (74%) of the vulnerabilities that scored Low in CVSSv2 increased to Medium when scored with CVSSv3.
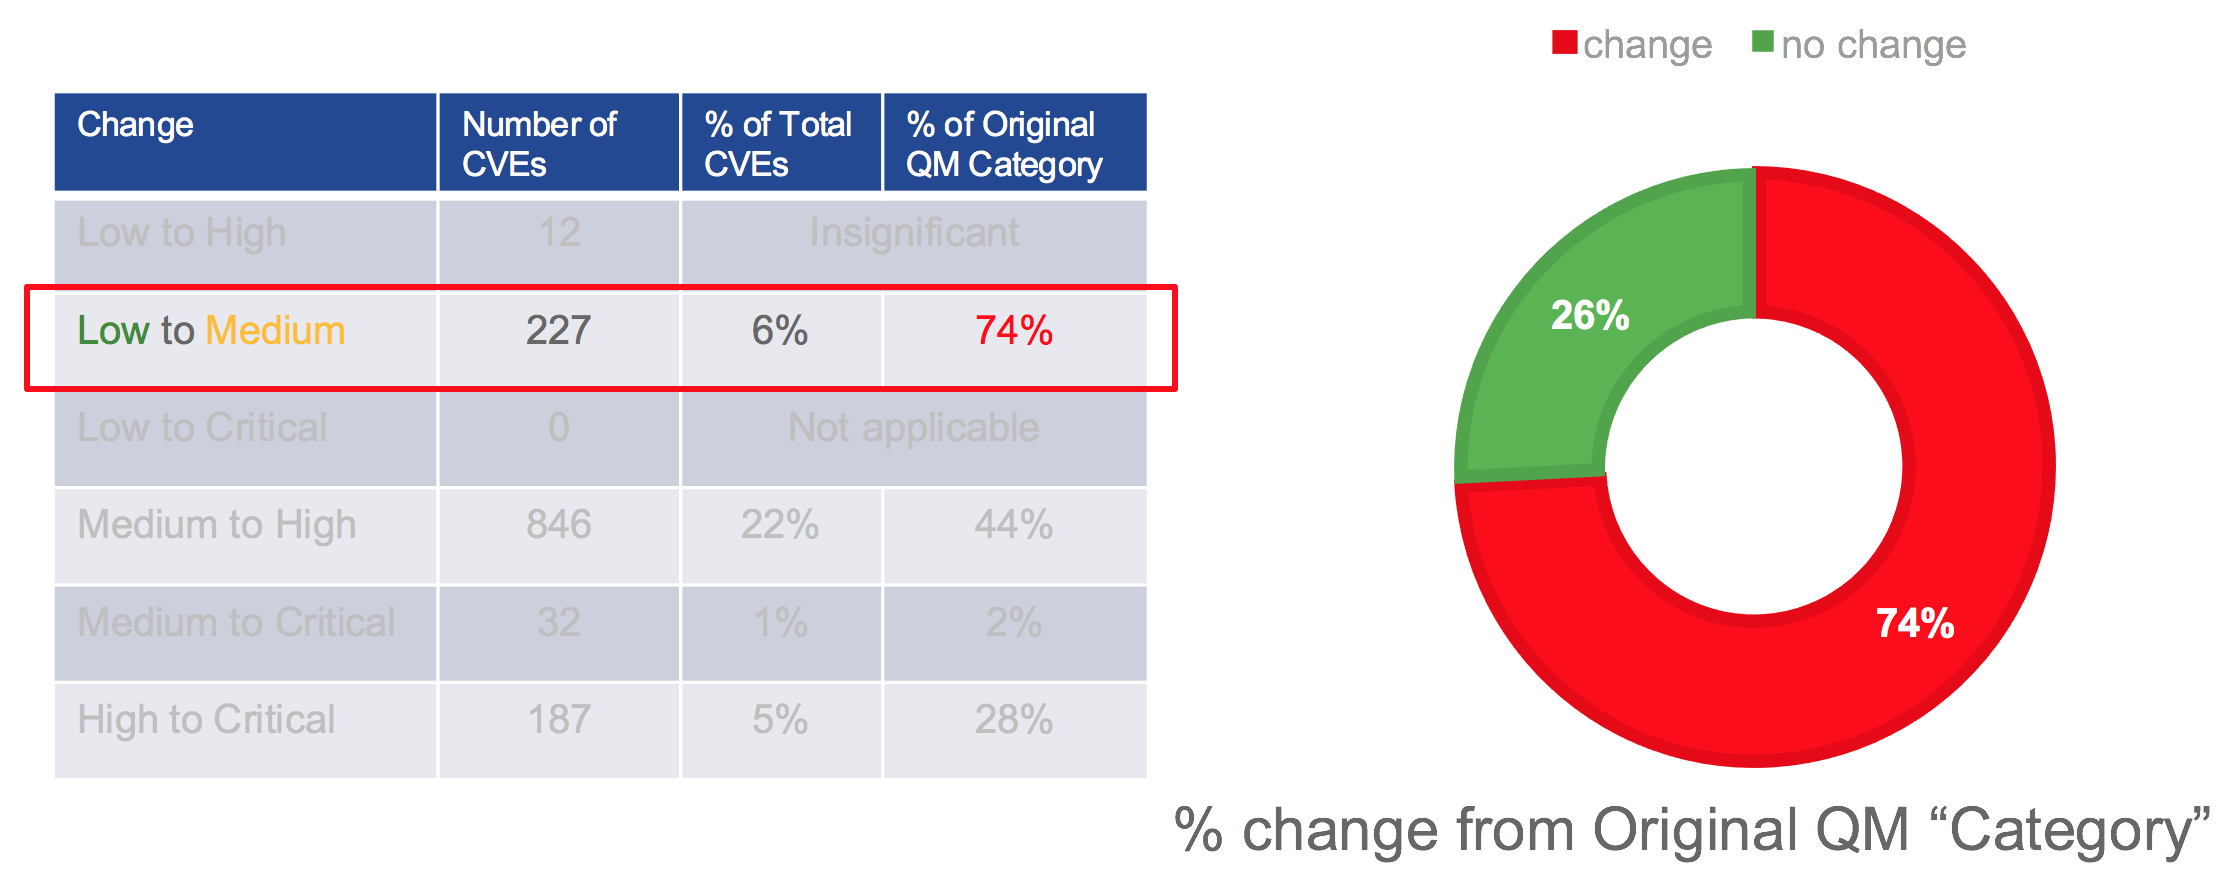
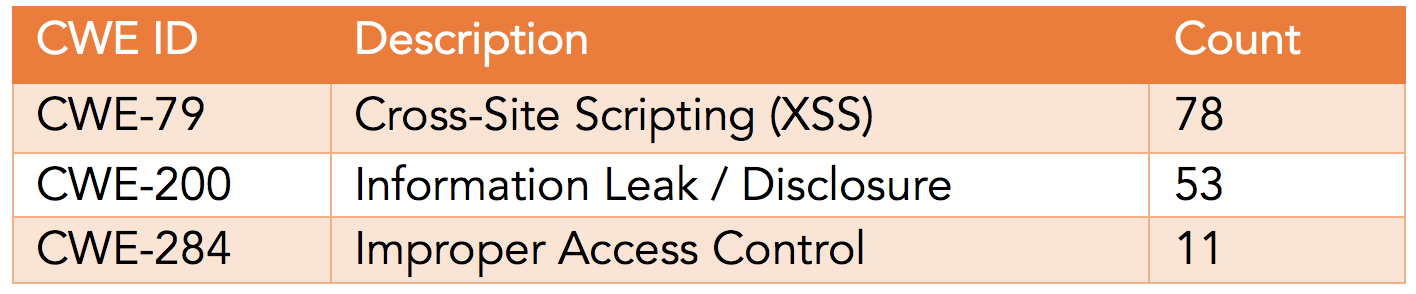
The following table summarizes the top 3 Common Weaknesses Enumerators (CWEs) of the vulnerabilities that increased from Low to Medium when scored with CVSSv3.
Forty-four percent (44%) of the vulnerabilities that scored Medium in CVSSv2 increased to High when scored with CVSSv3.
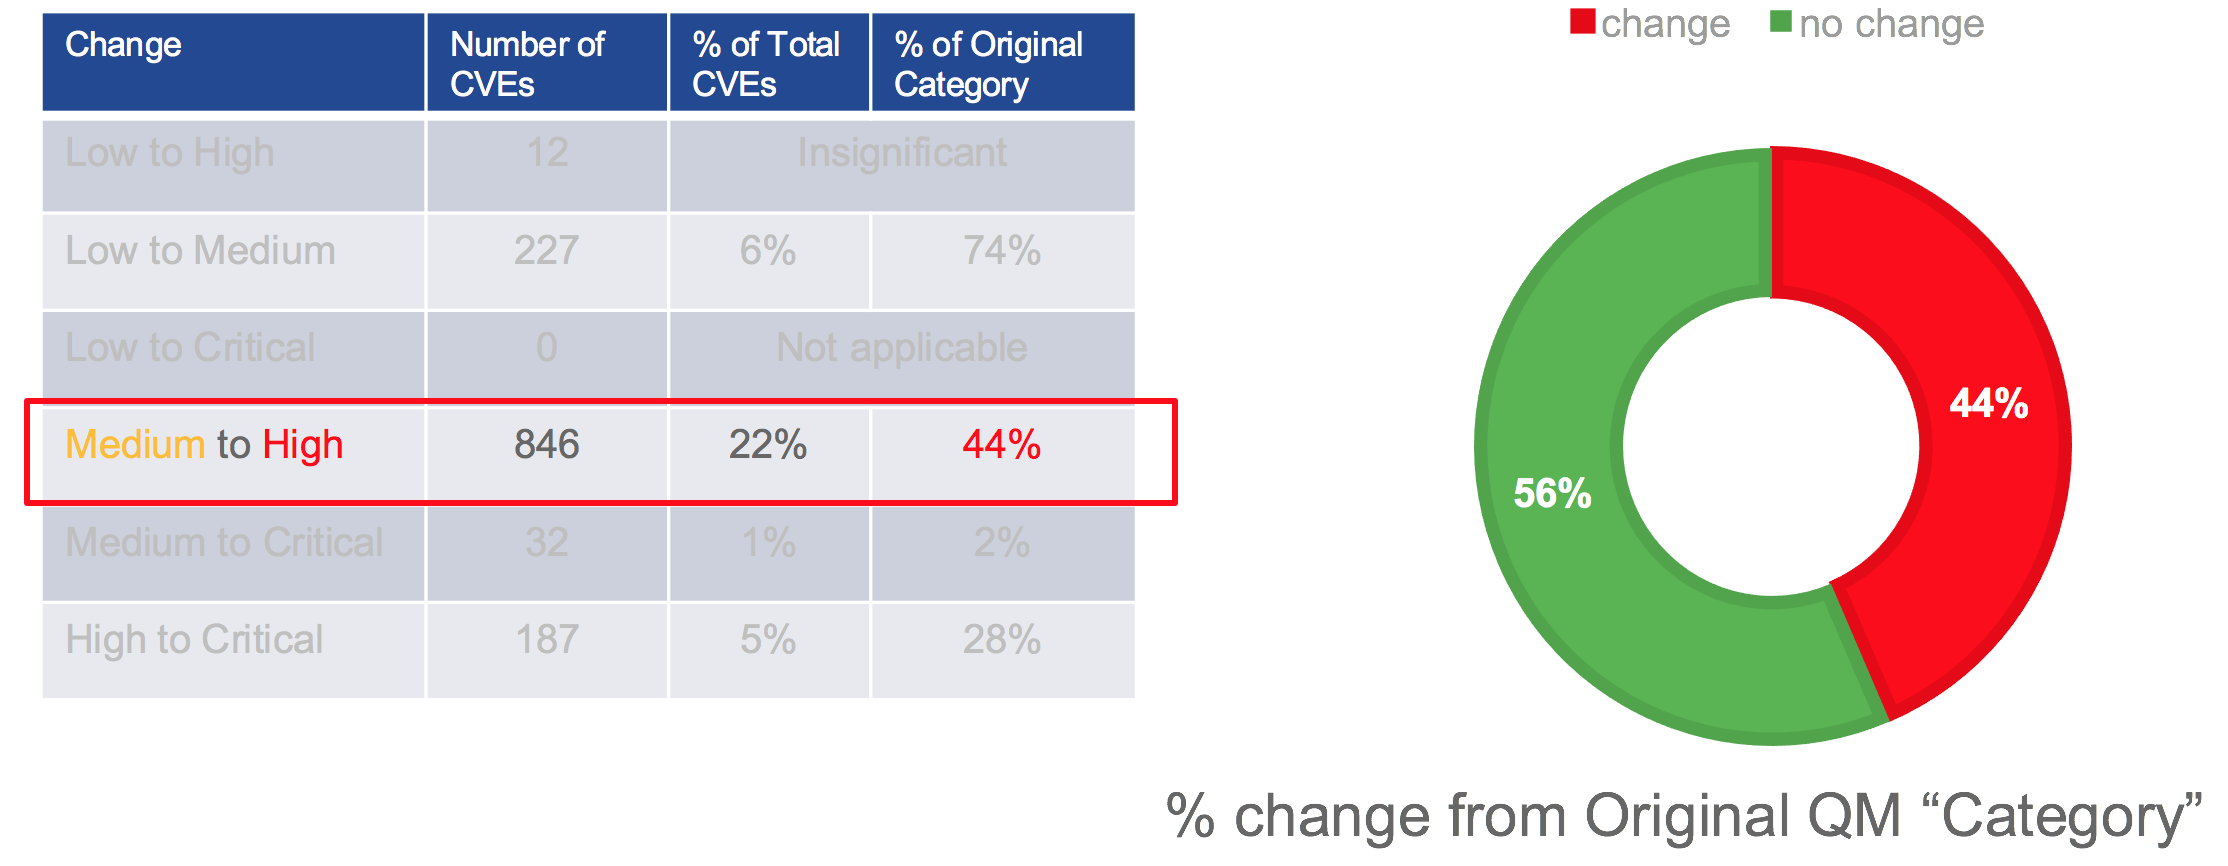
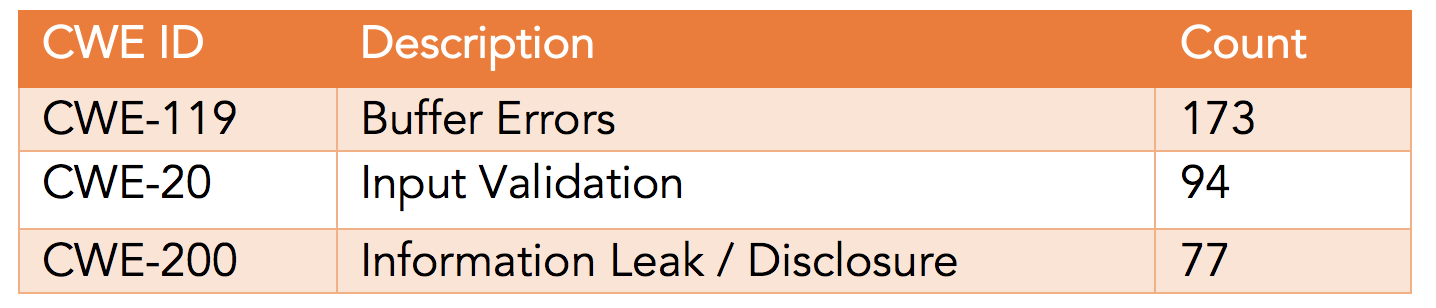
The following table summarizes the top 3 CWEs of the vulnerabilities that increased from Medium to High when scored with CVSSv3.
Twenty-eight percent (28%) of the vulnerabilities that scored High in CVSSv2 increased to Critical when scored with CVSSv3.
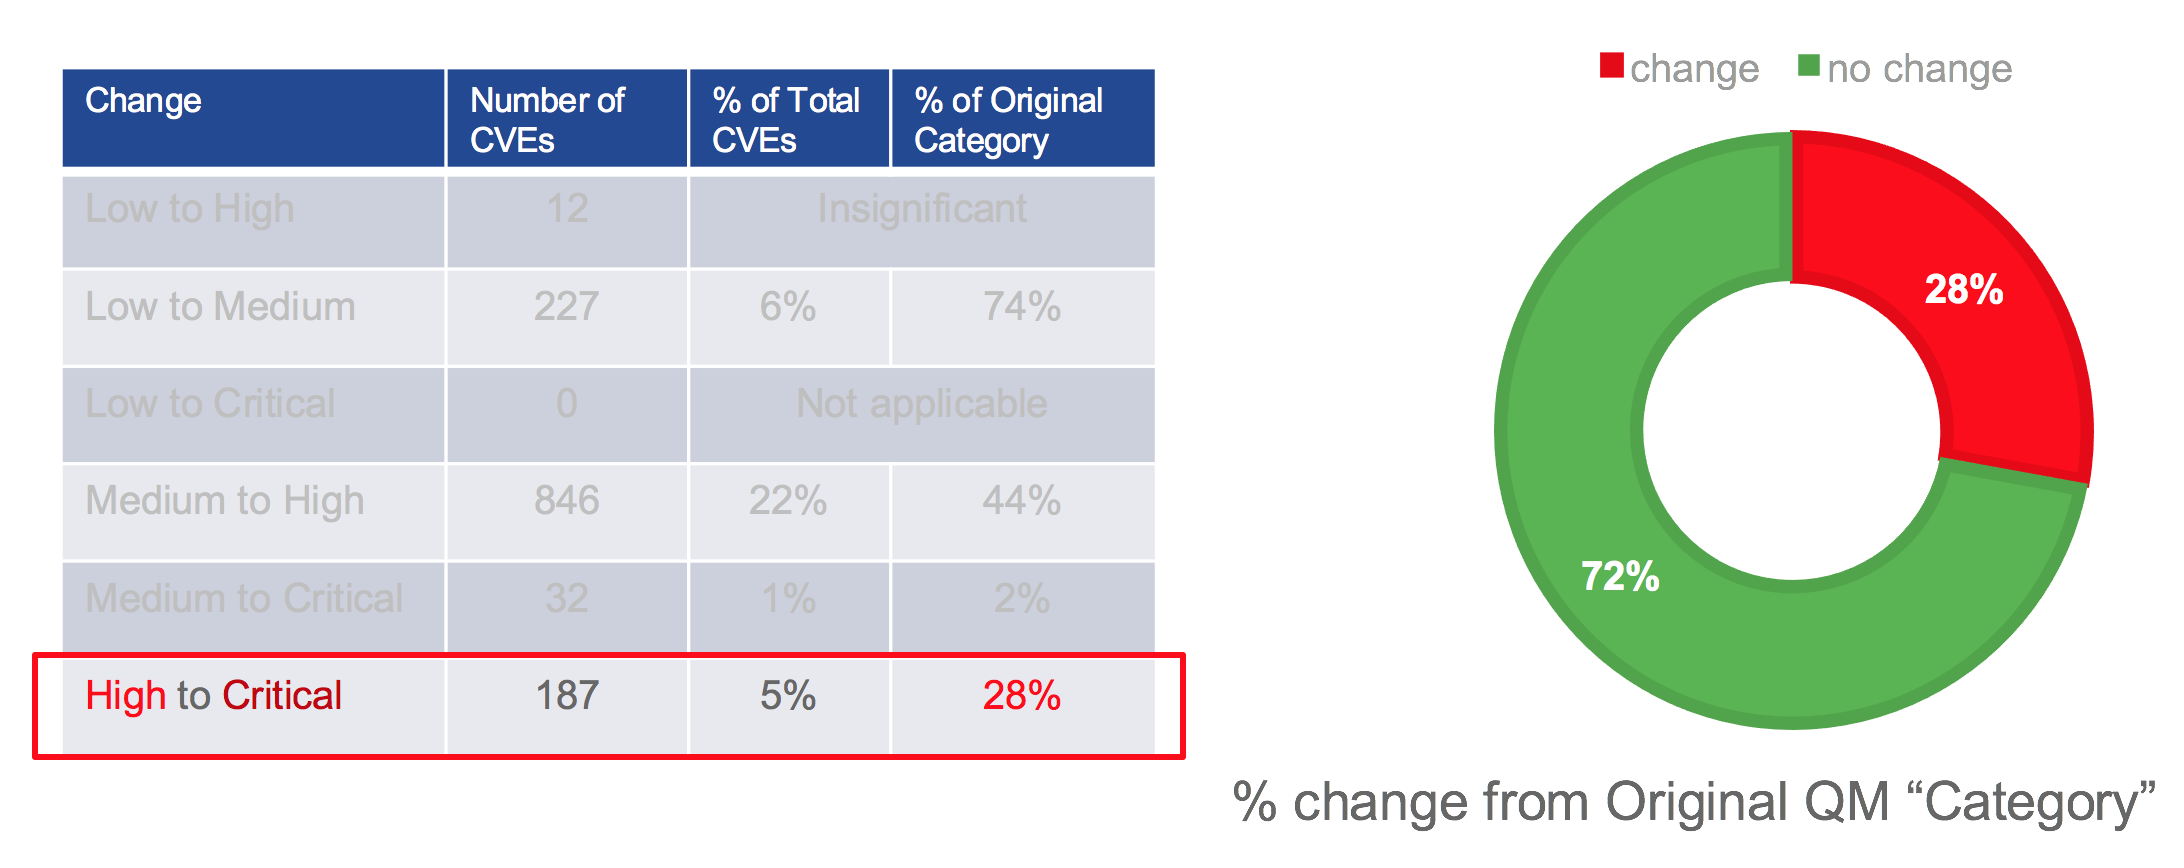
The following table summarizes the top 3 CWEs of the vulnerabilities that increased from High to Critical when scored with CVSSv3.
Why Should I Care?
One thousand seventy-seven (1077) vulnerabilities moved from Low or Medium to High or Critical. That is a 52% increase in High or Critical vulnerabilities.
As stated in our Security Vulnerability Policy in all of our security advisories:
“Cisco will provide an evaluation of the base vulnerability score, and in some instances, will provide a temporal vulnerability score. End users are encouraged to compute the environmental score based on their network parameters. The combination of all three scores should be considered the final score, which represents a moment in time and is tailored to a specific environment. Organizations are advised to use this final score to prioritize responses in their own environments. In addition, Cisco uses the Security Impact Rating (SIR) as a way to categorize vulnerability severity in a simpler manner. The SIR is based on the CVSS base score, adjusted by PSIRT to account for Cisco-specific variables, and will be included in every Cisco Security Advisory.”
Cisco takes a comprehensive approach to security and trust. Transparency and accountability in vulnerability management through Cisco’s Product Security Incident Response Team (PSIRT) is one of our core principles. This is why I want to share these results with you in anticipation of Cisco PSIRT using CVSSv3 in the first half of 2017.


Thanks for a really good explanation and I think CVSS v3 scores will more accurately reflect the impact of security issues on our customers.
For example, we had a vuln in one of our switches which severely affected adjacent nodes in the network while the switch with the vuln was not affected. Under CVSS v2 the severity was 5.x but I think with CVSS v3 the environmental score would pull up the overall score.
Thank you Bill! Yes indeed. CVSSv3 has introduced a lot of great enhancements that addressed some of the challenges that existed in CVSSv2. CVSSv3 analyzes the scope of a vulnerability and identifies the privileges an attacker needs to exploit it. The enhancements to CVSS will allow vendors, such as Cisco, to better analyze security vulnerability impact. The changes will also more clearly define the urgency of responding to the vulnerability for our customers.
Looking forward to the adoption of the CVSS3 metrics at Cisco first and everywhere else next!
One additional detail: I always found the cited text stated in our security advisories thoughtful and clear: “End users are encouraged to compute the environmental score based on their network parameters. The combination of all three scores should be considered the final score, which represents a moment in time and is tailored to a specific environment. Organizations are advised to use this final score to prioritize responses in their own environments. ”
But (still) wonder if the important active part really picked up by product teams and customers in their mitigation plans?
Maybe we could offer a future blog with practical info together with sample extrapolations of such scores (accounting for environmental contributions)?
That is a really good suggestion, Stefan! I will consider it for a future article.
What I am seeing nowadays — after talking to several customers and folks in the industry that consume our (and any other vendor) vulnerability reports — is that not a lot of people use /calculate environmental scores. Mostly because of scalability reasons (i.e., due to the number of vulnerabilities that they have to process). They only pay attention to the base score and in some cases just at the Qualitative Severity Rating (what we call Security Impact Rating); which is whether the vulnerability base score is considered critical, high, medium, or low.