The year 2020 has brought about changes in the way people go about their daily lives. The pandemic is reshaping society in ways that are unfamiliar and sudden. To understand what industries can expect when the pandemic slows down and also better prepare for any future crisis, they need to analyze and take measure of how the pandemic changed the customers’ behavior towards businesses and its physical spaces. For example — are there fewer retail customers now as compared to before the pandemic? How has their visit frequency changed and are they spending more time now in-store or less? There is an assumption that market segments like transportation and hospitality would be impacted more than others like Healthcare, but is there real data to prove it?
One of the ways to get answers to these questions and more is to leverage a technology that we are all familiar with – Wi-Fi. Wi-Fi is now an essential service available everywhere, from enterprise workspaces to coffee shops, from universities to malls. Given the pervasiveness of Wi-Fi and the close correlation between wireless client count and visitor/user count in a physical space, we are better able to understand user presence and behavior.

Cisco DNA Center and Cisco DNA Spaces cover more than 10 million client devices, more than one million access points, and digitize close to 2.8 billion square feet of enterprise airspace. With such a massive anonymized data set (until the end of April 2020) in hand and with the broad coverage of deployments that Cisco has, we set out to analyze how businesses in different market segments were affected by the pandemic. We take some of the observations from the real world and see if the data collected by Cisco also shows similar observations.
Overall impact on wireless client count

While new infection cases were being reported in early February in countries outside of China, such as South Korea and Italy, much of the rest of the world continued along with business as usual. In the beginning of March, the seriousness of the pandemic was being felt throughout the world. News about possible restrictions to mitigate the transmission of the virus were being announced around the second week of March, culminating with a national emergency declaration on March 13th in the United States.
Given the shelter-in-place orders that were mandated in mid-March across many geographies, there was a sudden and severe drop experienced in people density across many businesses and market segments.
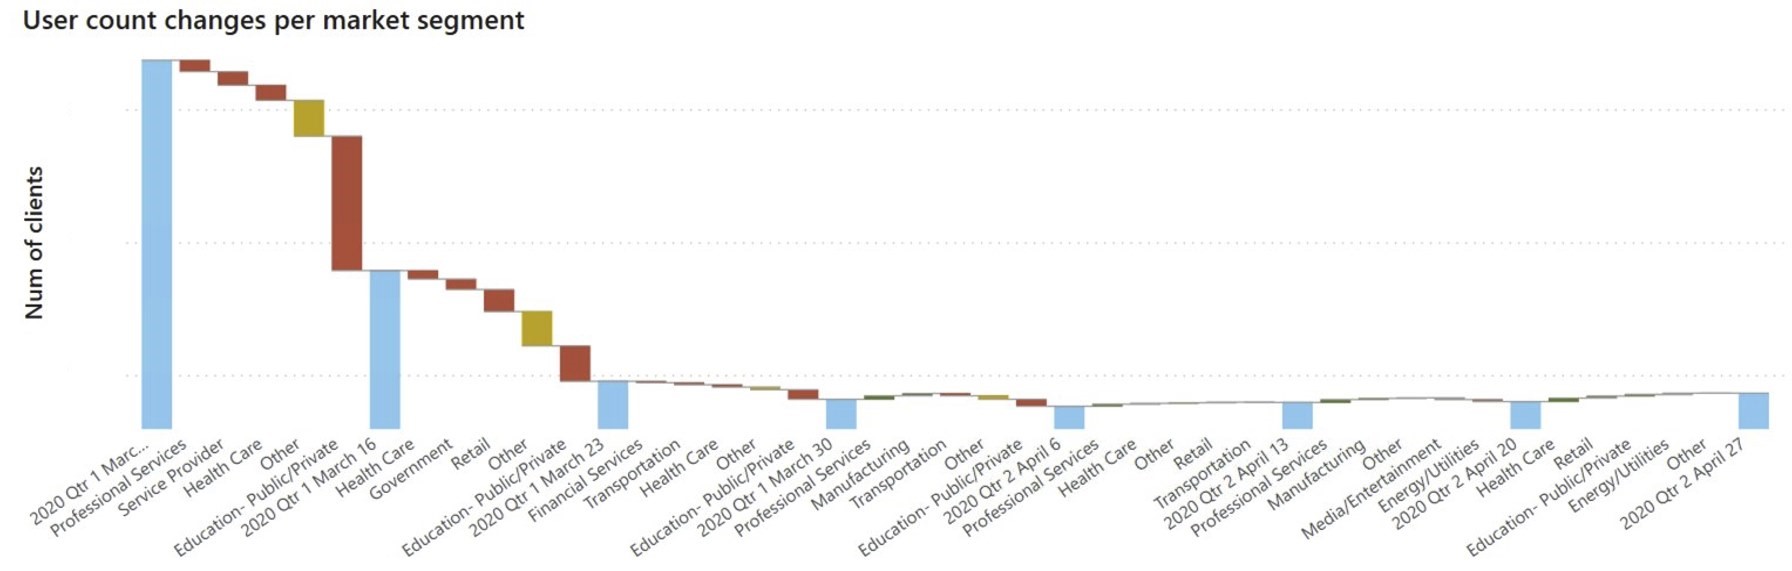
If we look at the overall wireless client count from Cisco DNA Center deployments around the world — including all regions and market segments — it began dropping in the week of March 16th with a sharp fall continuing until the end of March:
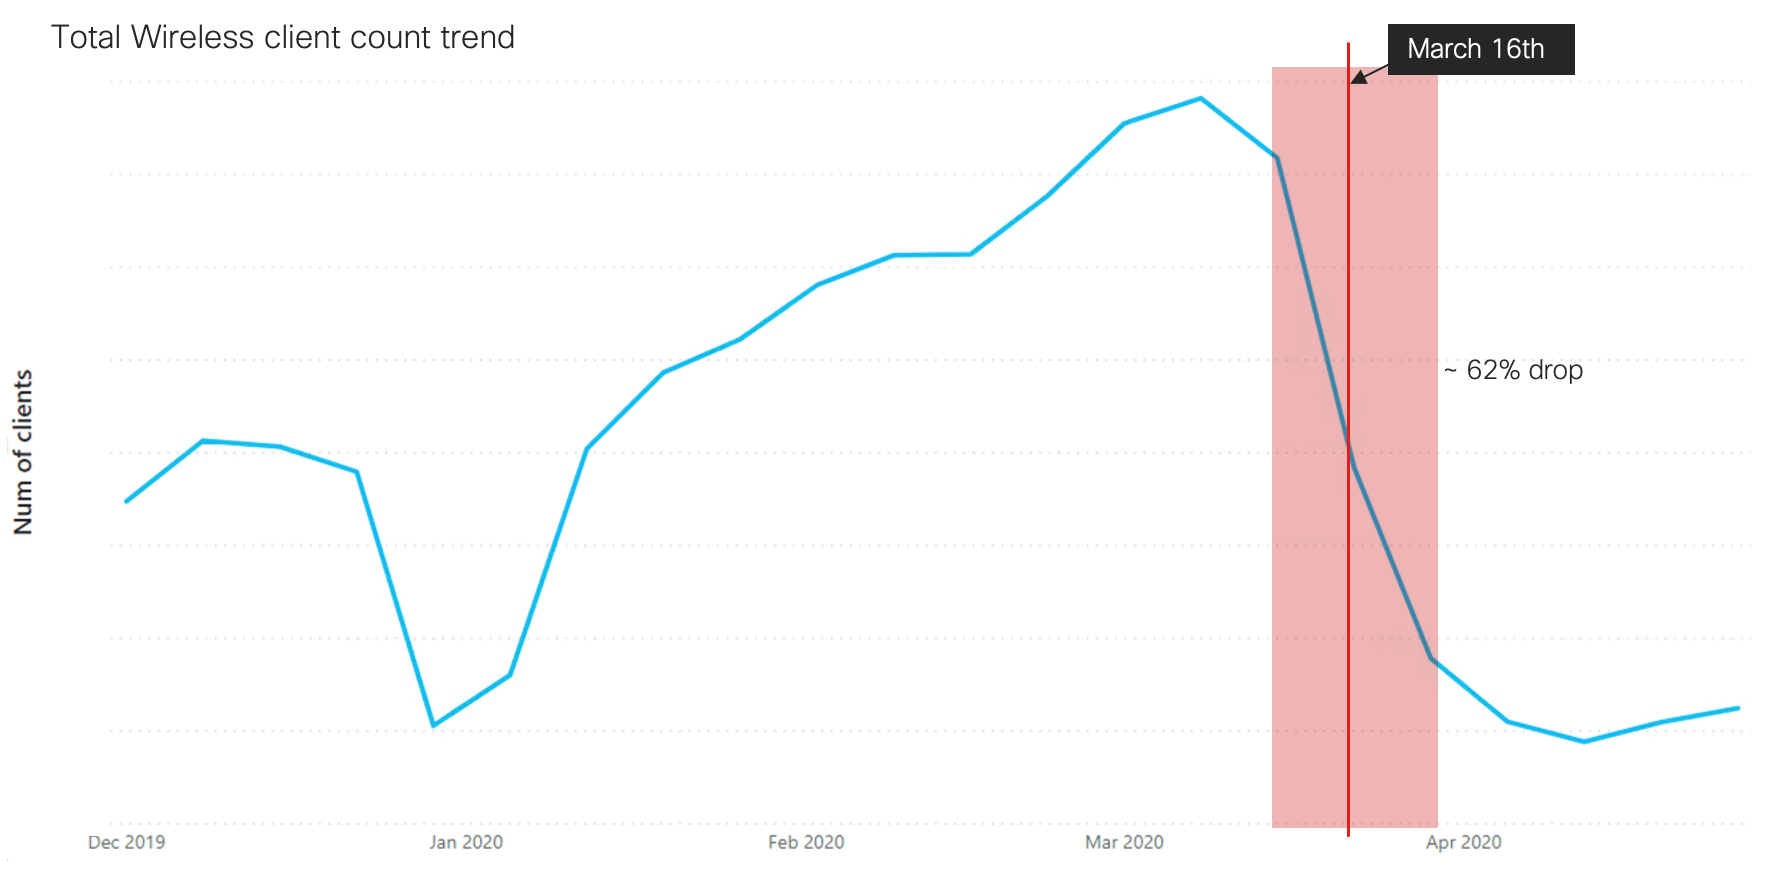
There was a 62.35% drop in client count from March 9th until March 30th.
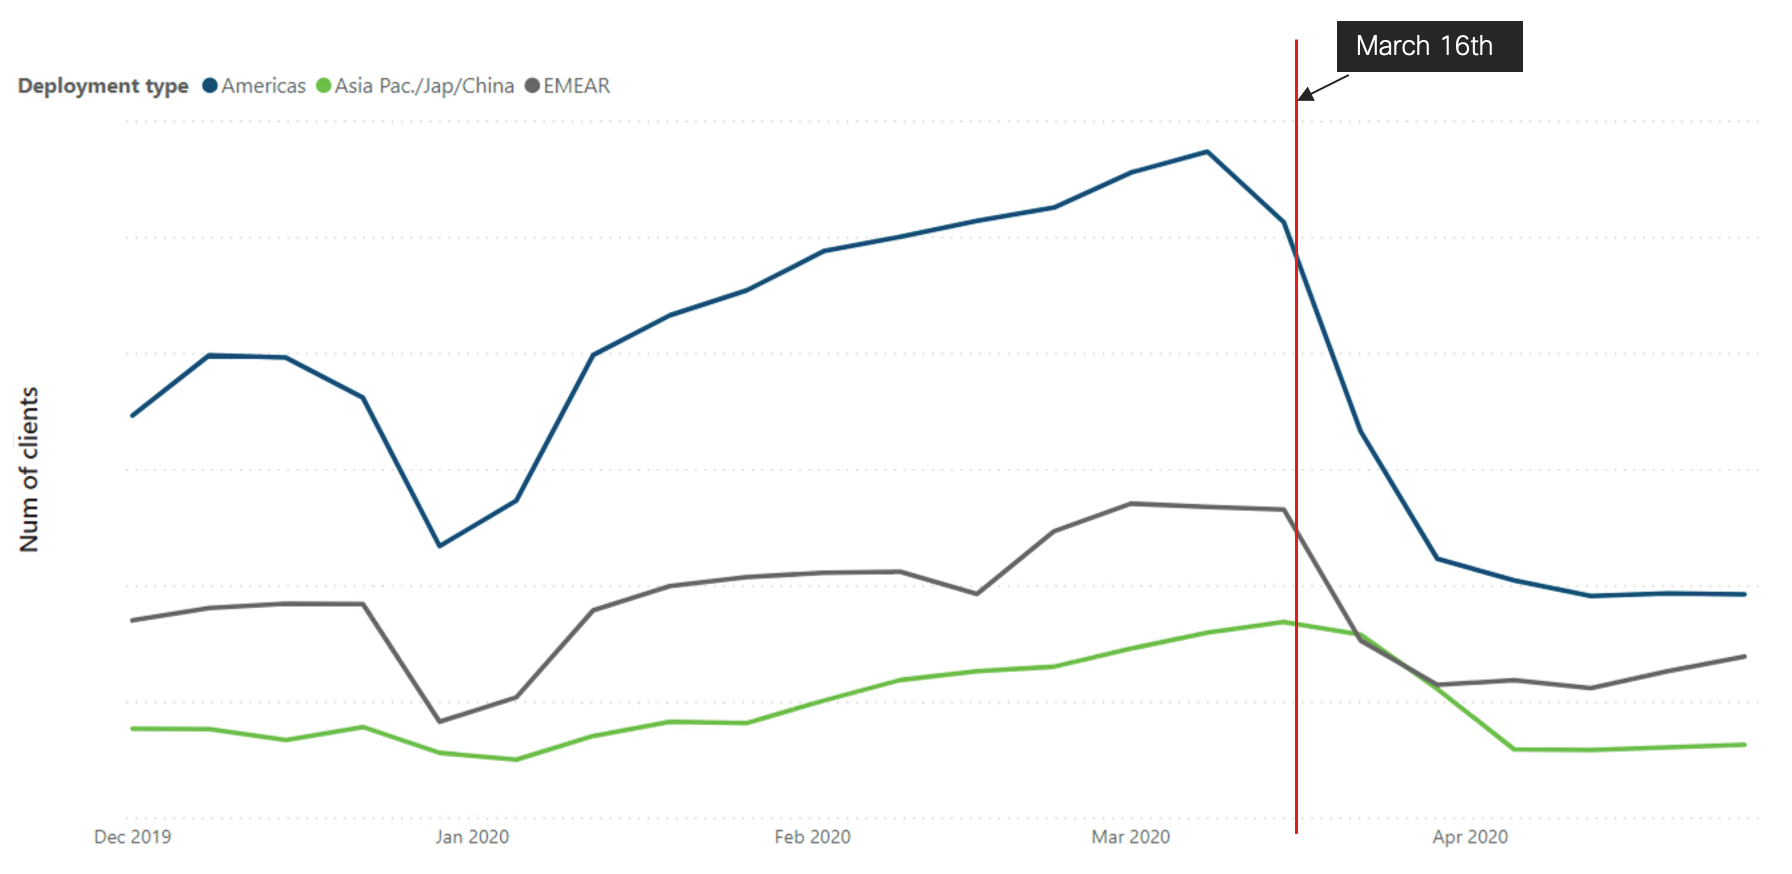
To understand which regions contributed the most to the fall, look at the overall client count split by regions. Almost every region showed a similar trend of declining count starting from the second week of March:
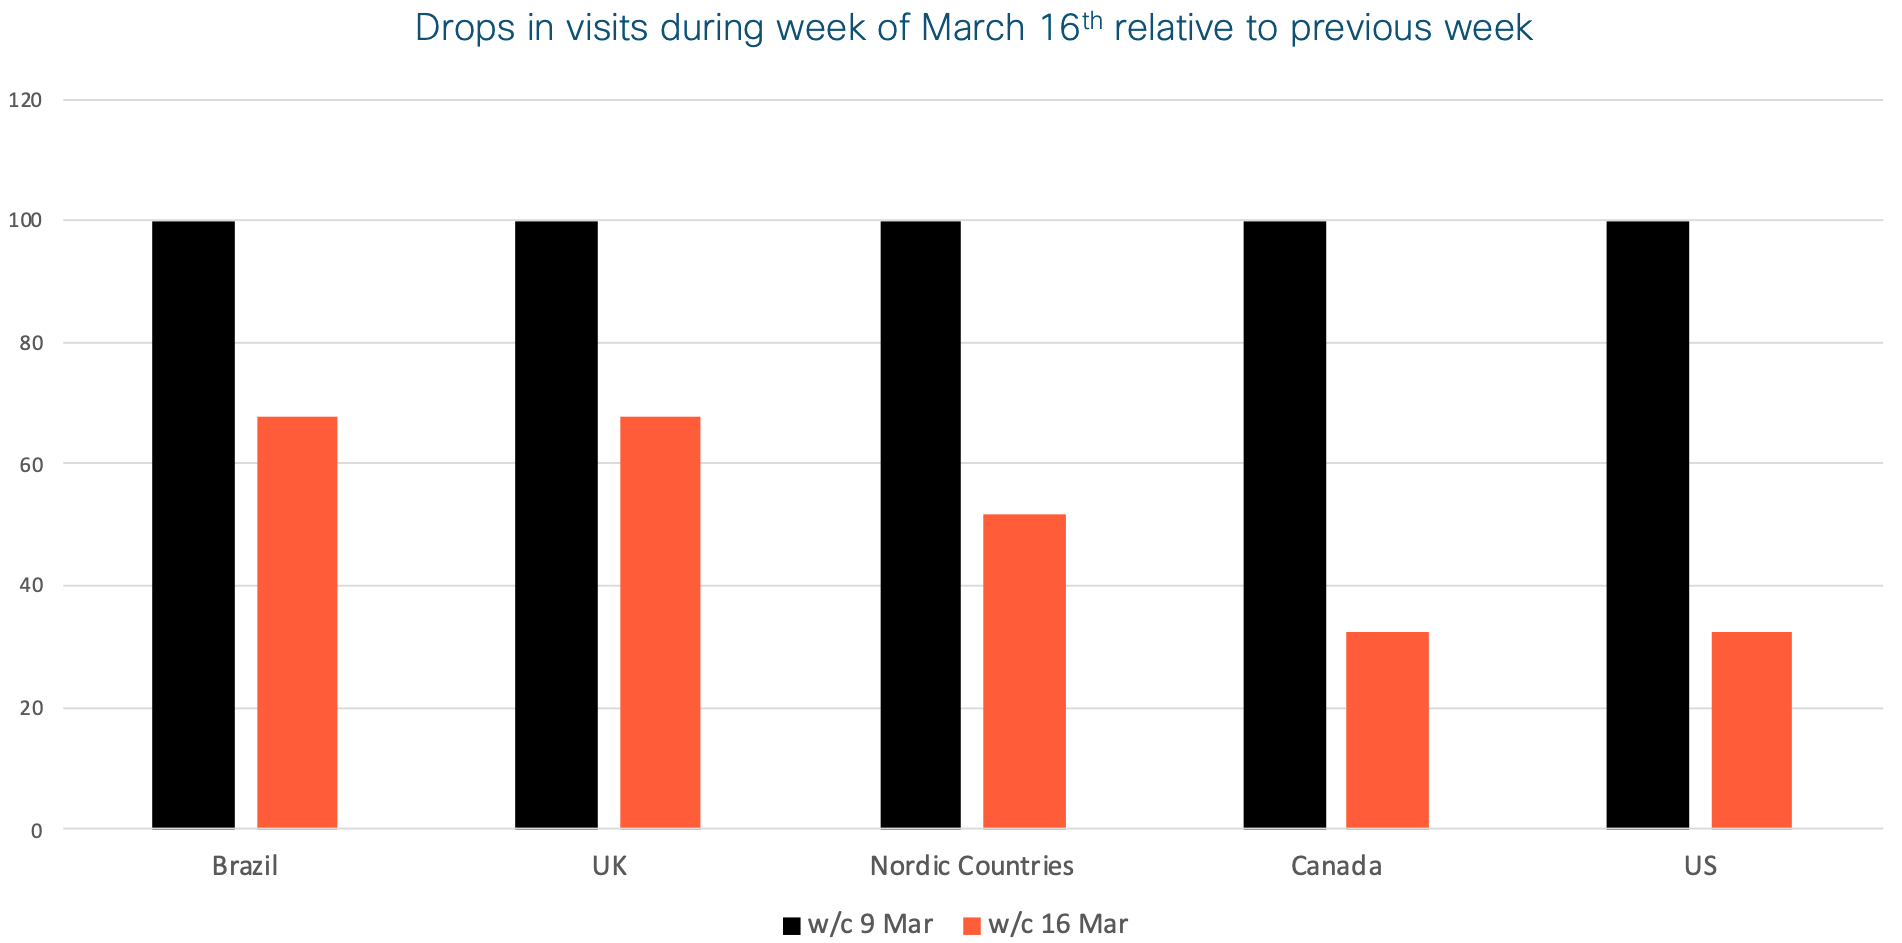
The data collected by Cisco DNA Spaces also aligns with this observation and shows that the drop in user visits was universal and happened across all geographies. Most countries experienced record drop-offs in the same week despite differing social distancing policies.
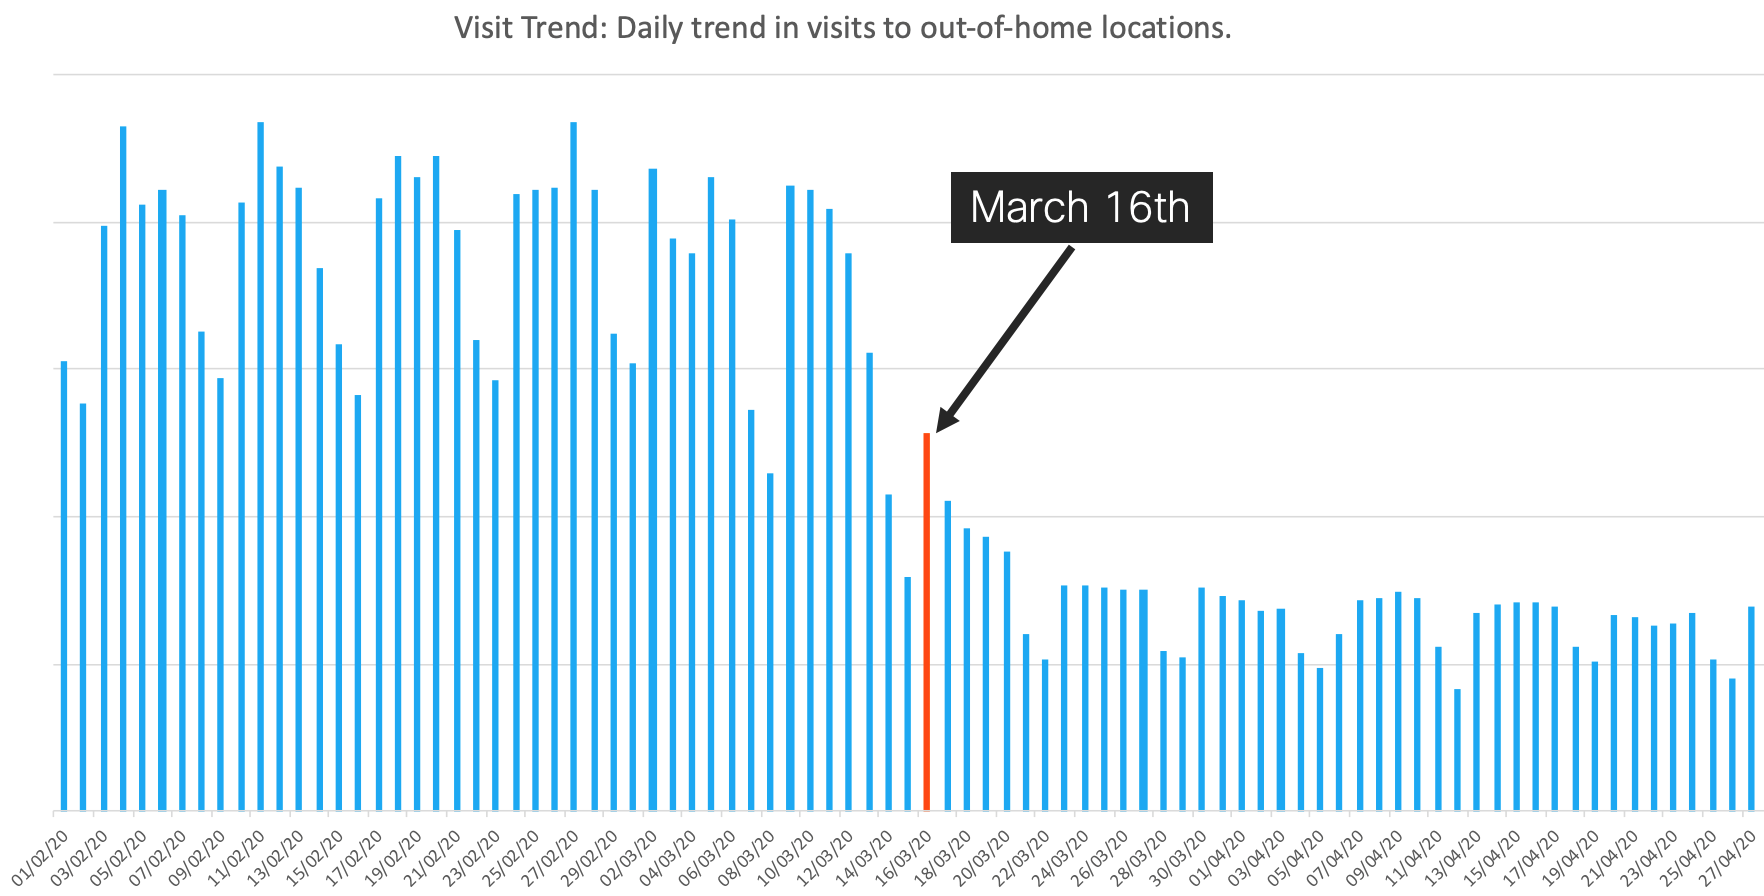
People presence in the US also dropped suddenly in a single week beginning Monday the 16th:
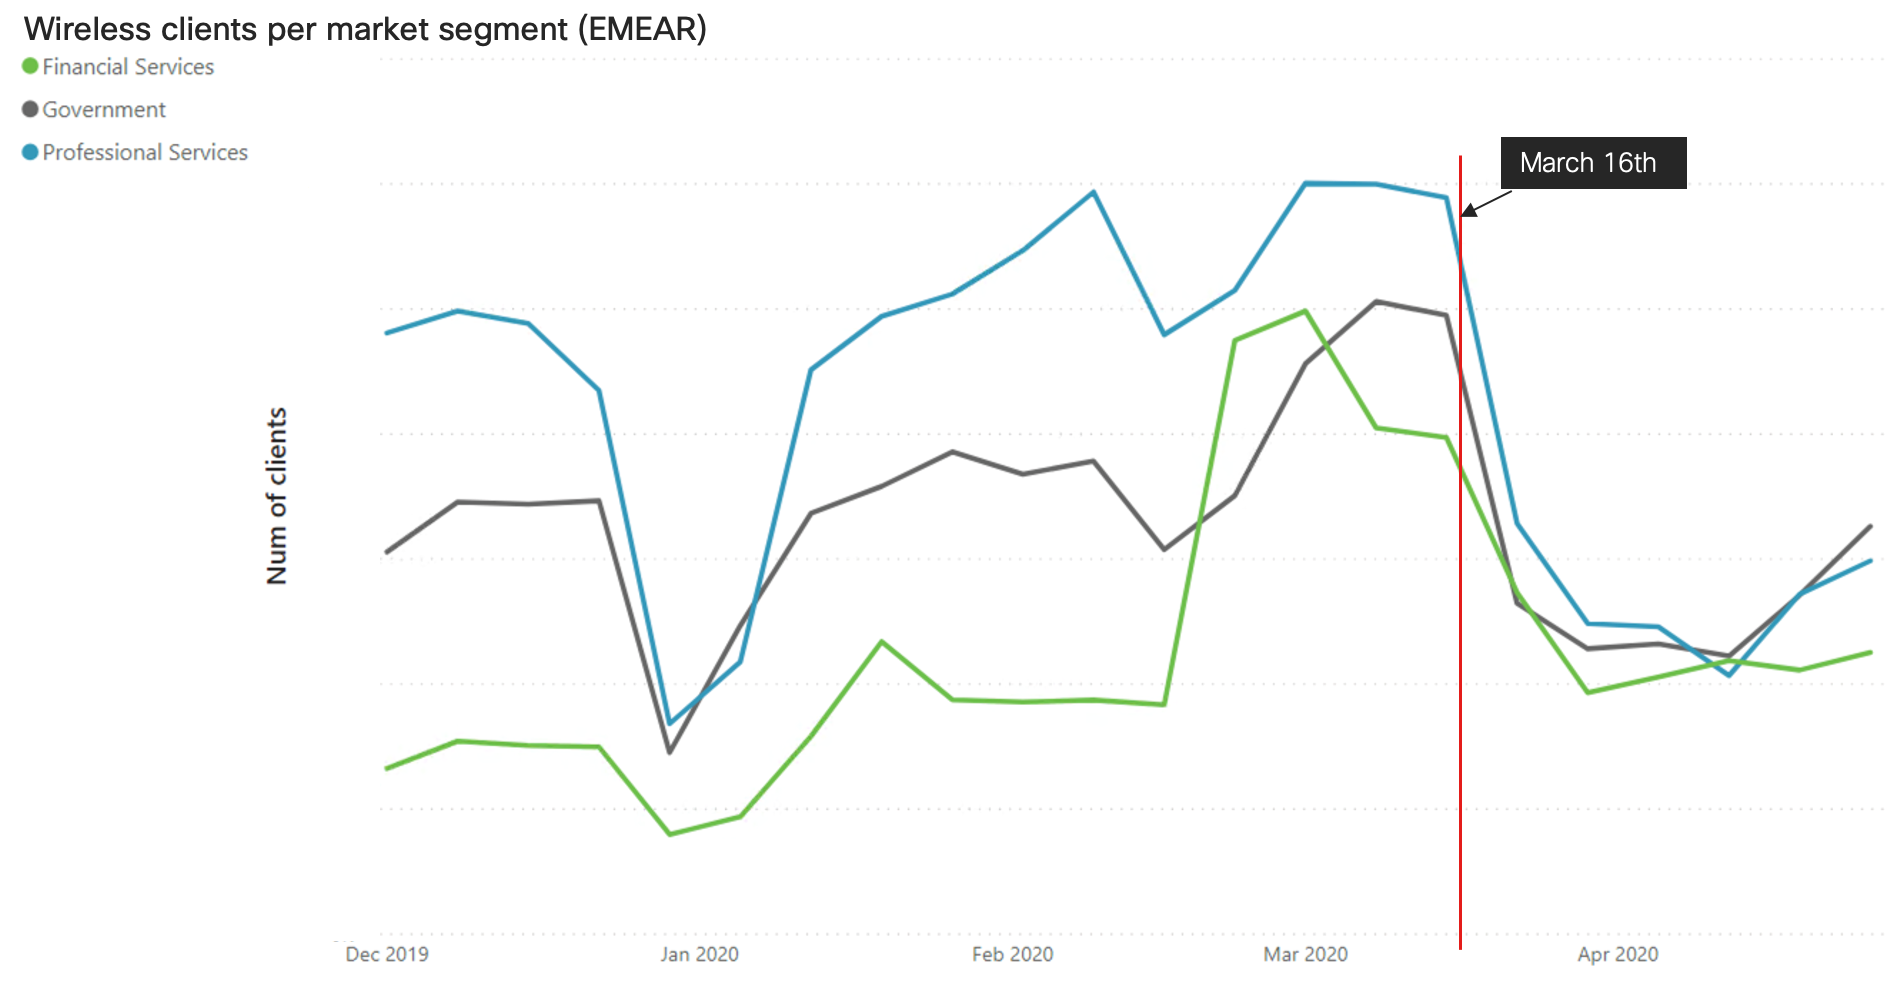
While the decline has been similar between the different regions, the recovery since the second week of April has been different. While the Americas and Asia Pacific, Japan and China (APJC) are showing a modest increase in client count numbers by 5.58% and 3.22%, Europe, the Middle East, Africa and Russia (EMEAR) region is leading the recovery with an increase of 49.43%. Within the EMEAR region, the biggest contributors to the recovery have been Professional Services, Government and the Financial Services segment.
Impact on user presence in different market segments

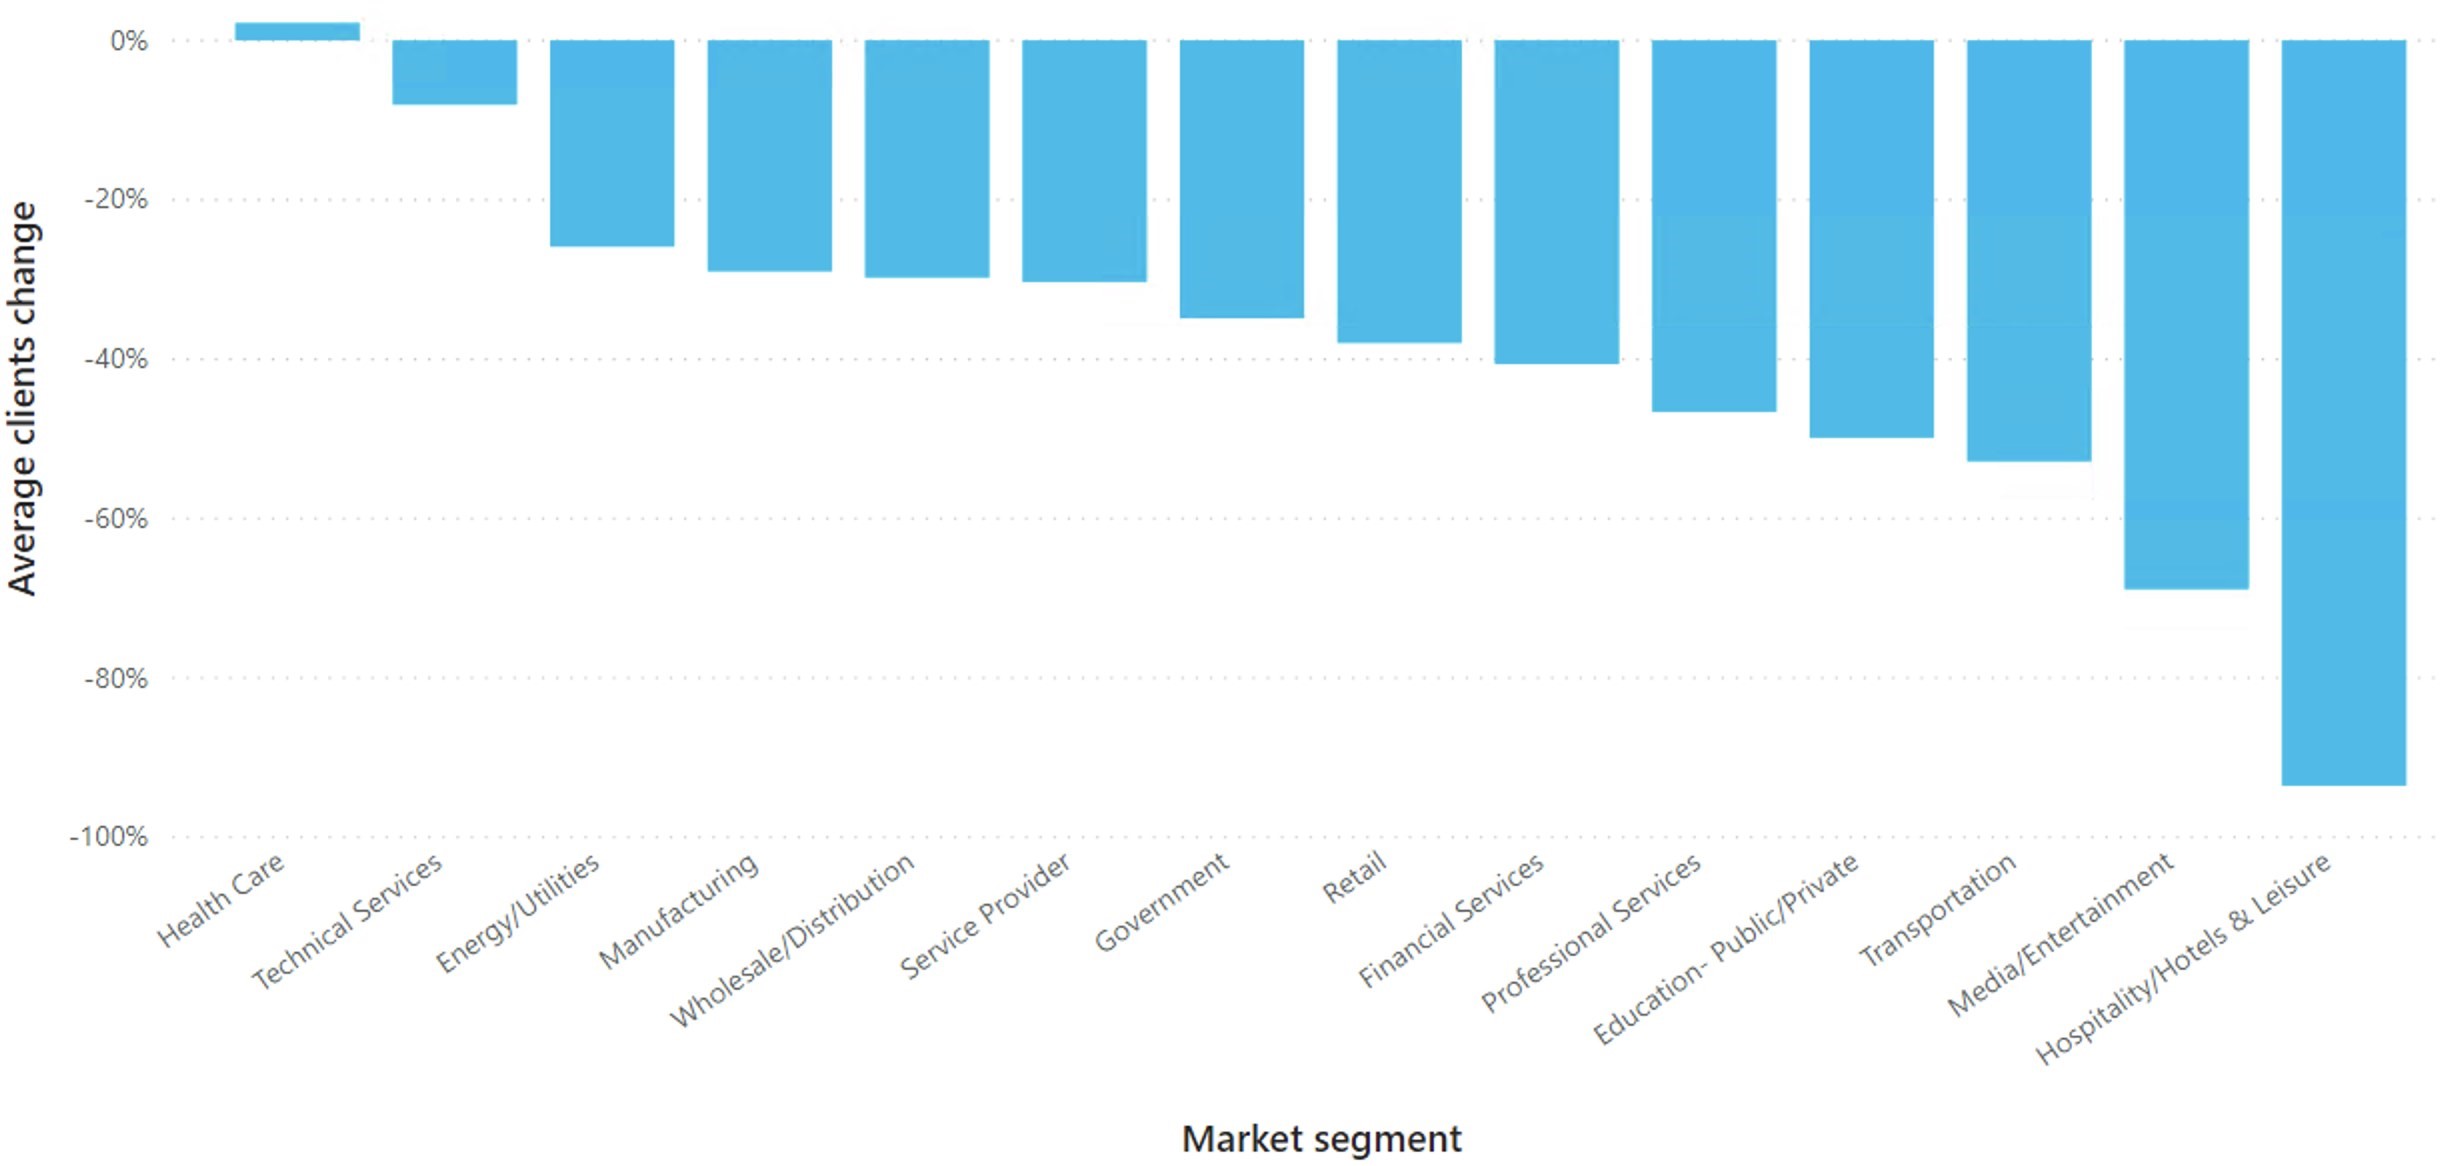
Understandably during stay at home orders, verticals like Hospitality, Transportation and Education were expected to be impacted much more than other more essential verticals like Healthcare, as they had to continue working at the same or higher scale. The data collected from our customers validates this.
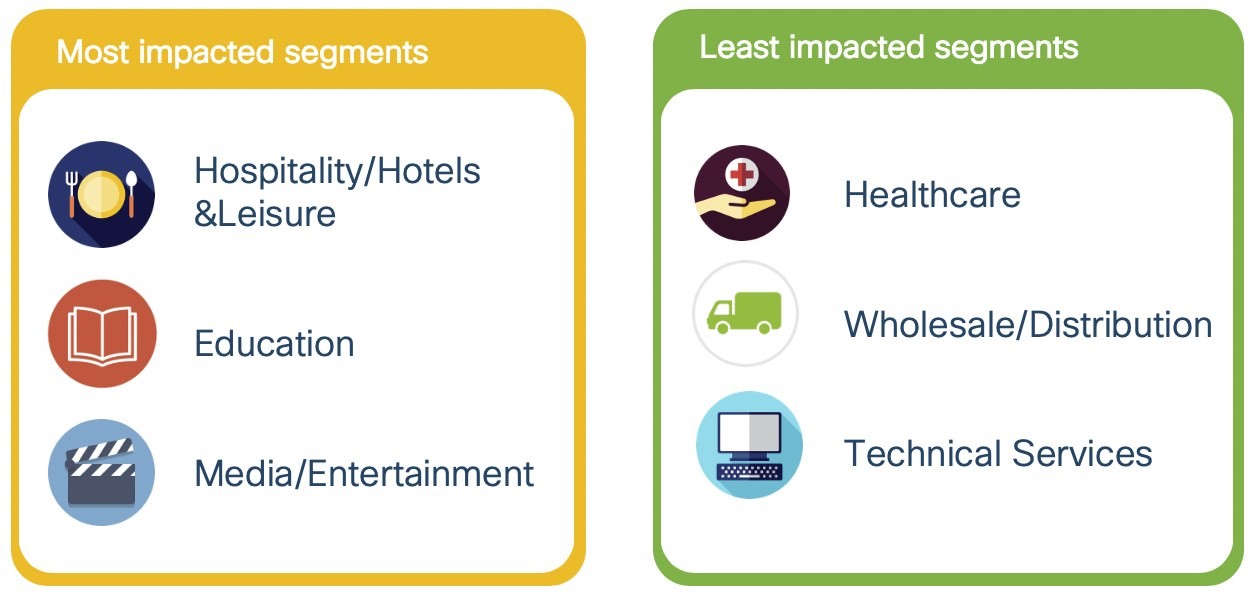
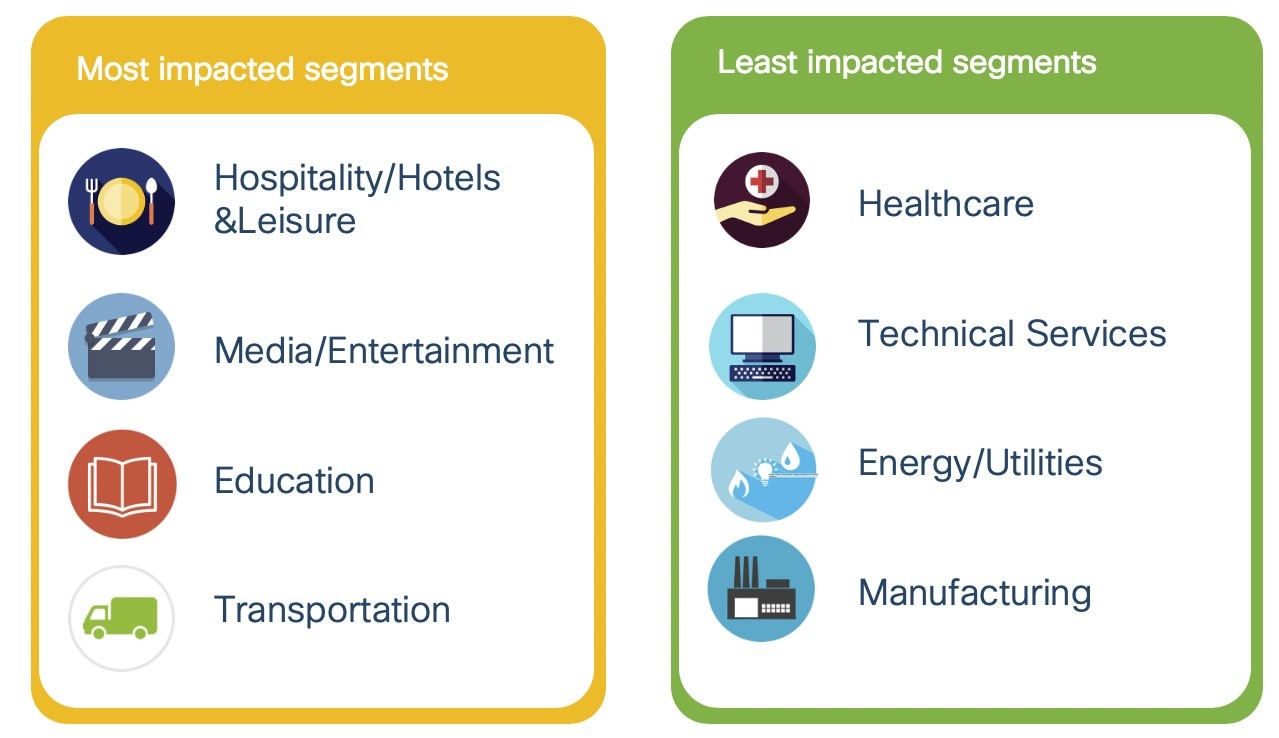
To measure the impact of user presence in different market segments, we take the latest client count for that segment and compute the percentage change from the historical average for that market segment. This analysis reveals the top three segments that were most impacted and least impacted:
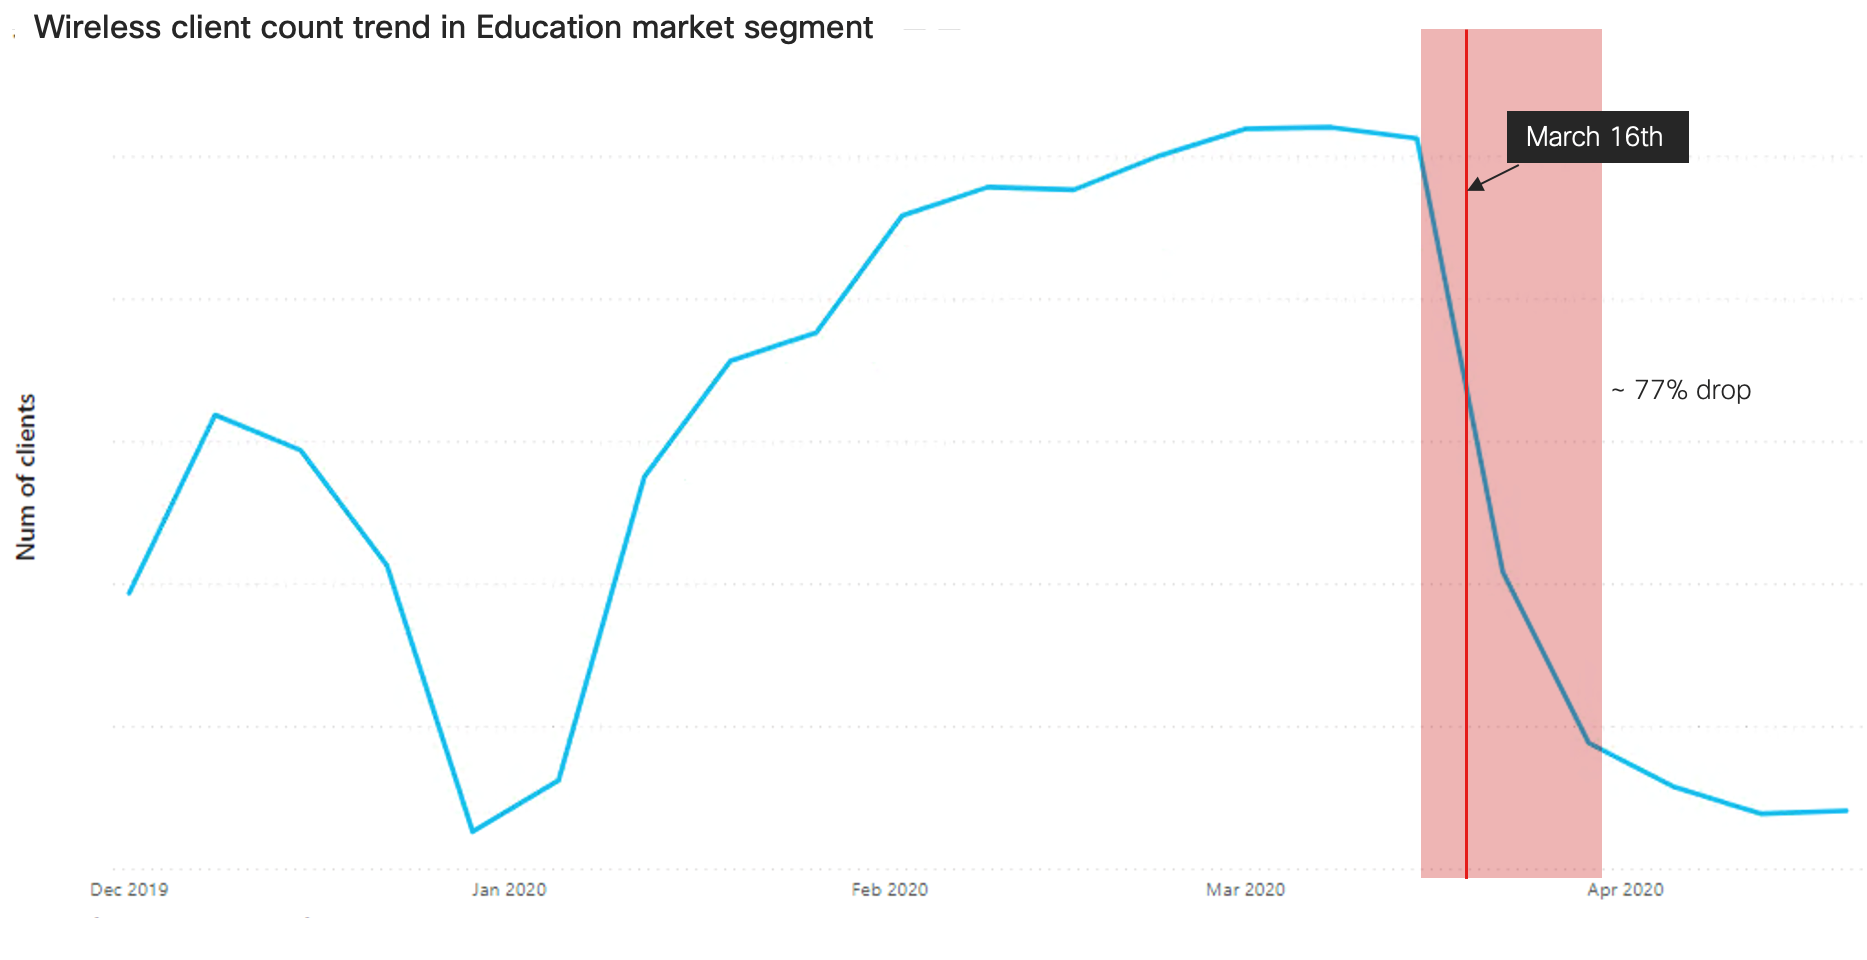
The Education segment is one of Cisco’s largest, with close to 1.5 million clients reported through Cisco DNA Center. With universities and schools closed down for the academic year two-and-a-half months early, this segment was severely impacted. The client count went down by 77.02% in the last three weeks of March:
While one might suspect that a pandemic would cause user presence to jump in the Healthcare market segment, the data collected shows that it has in fact seen a drop in user presence as well, though it was relatively lower than other segments. The reason for this drop is because people are preferring to do virtual or on-phone appointments with their Healthcare teams during this crisis. Additionally, people were pushing their elective surgeries and non-critical appointments out to a later date. We see this in New York, one of the hardest hit states, as emergency room visits in New York City health and hospital locations were down by 50% in March. In Providence, Rhode Island, the volume of heart attack patients fell by about 50% in March. Physicians suspect that this was because patients with mild heart attacks or strokes were going to family doctors or outpatient clinics instead of visiting the ER.
We filtered out the data for just the Healthcare segment to see if our observation correlates with this.
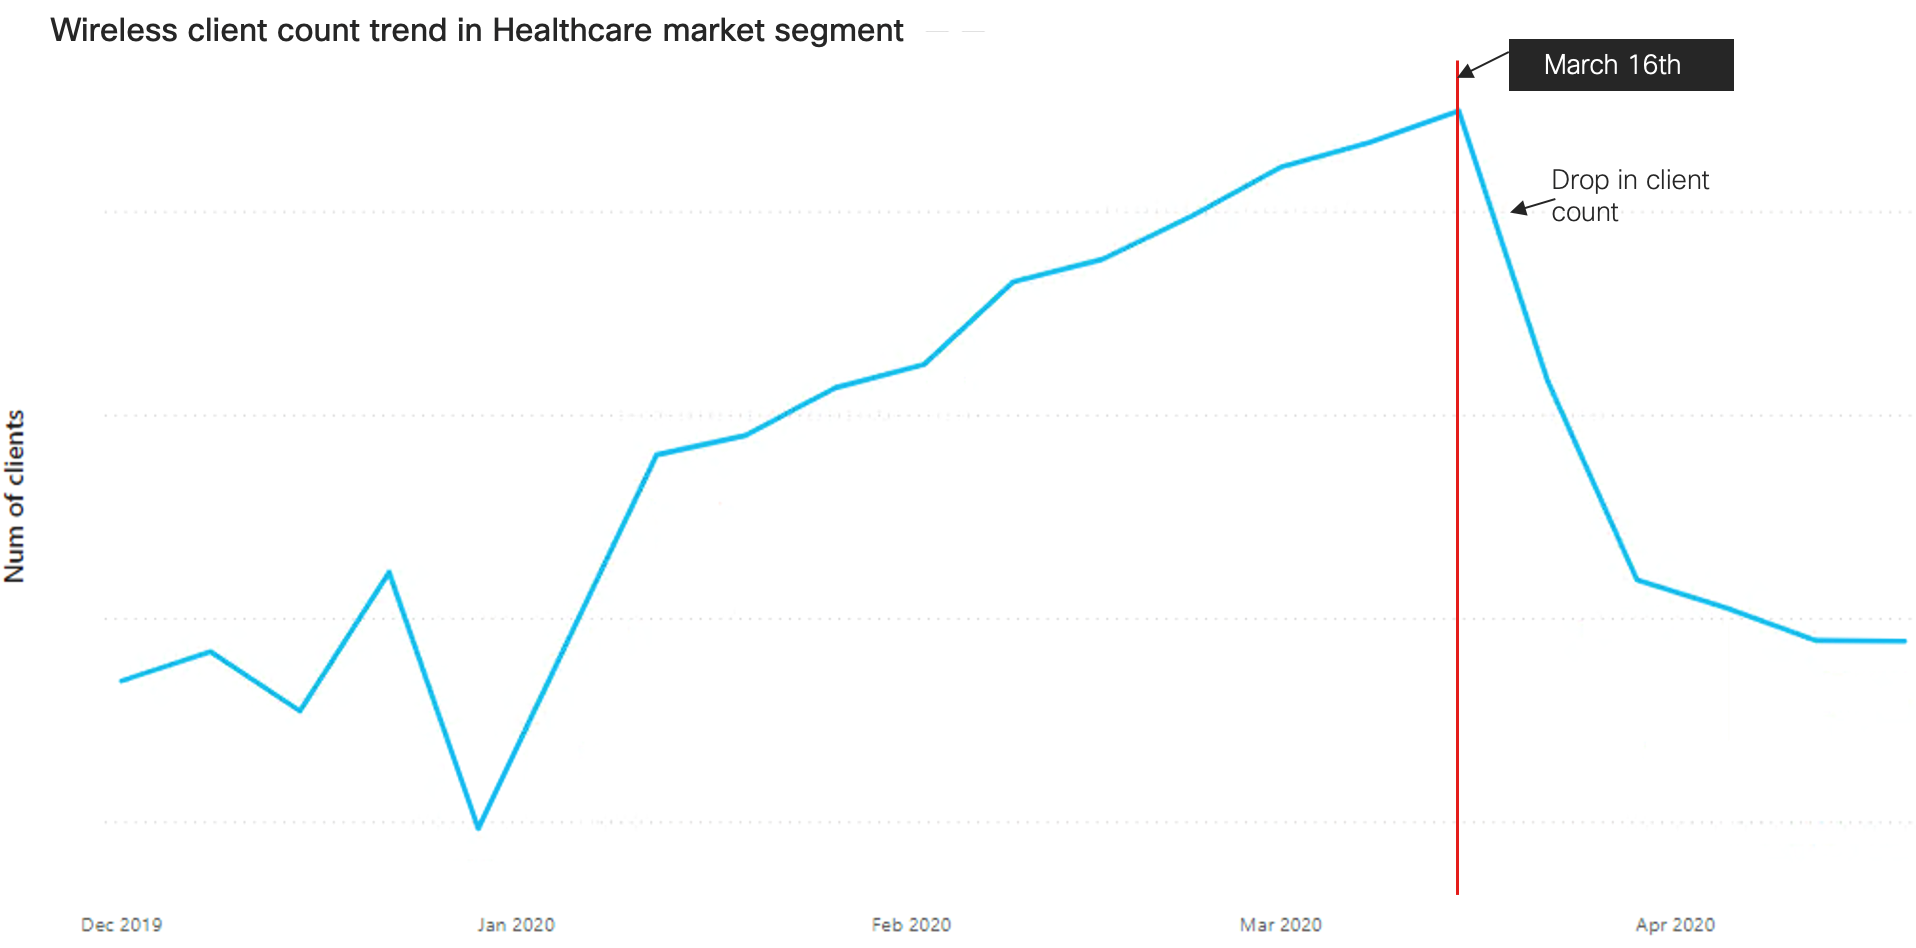
Notice the dip in the month of March. The fear of visiting hospitals did indeed impact the Healthcare market segment.
Regional differences
It would be interesting to analyze how the impact on businesses has been different in different countries based on the timelines of the pandemic, their approach to mitigating the impact of the virus, and other unique incidents that happened in their regions.
China
On December 31, 2019 China first reported cases of COVID-19 to the World Health Organization (WHO). By March 19th, China reported that there were no new local transmissions for the first time since the pandemic began.
This timeline is very different from the rest of the world. While the rest of the world was entering the initial stage of the transmission of the virus, China was on its way to a recovery. As a result, we should expect a difference in the data that we see from China as compared to the rest of the world.
The wireless client trend for China shows a dip after 2nd week of January. The steep drop continues until the first week of February (decline of 91.5%) after which it shows a recovery:
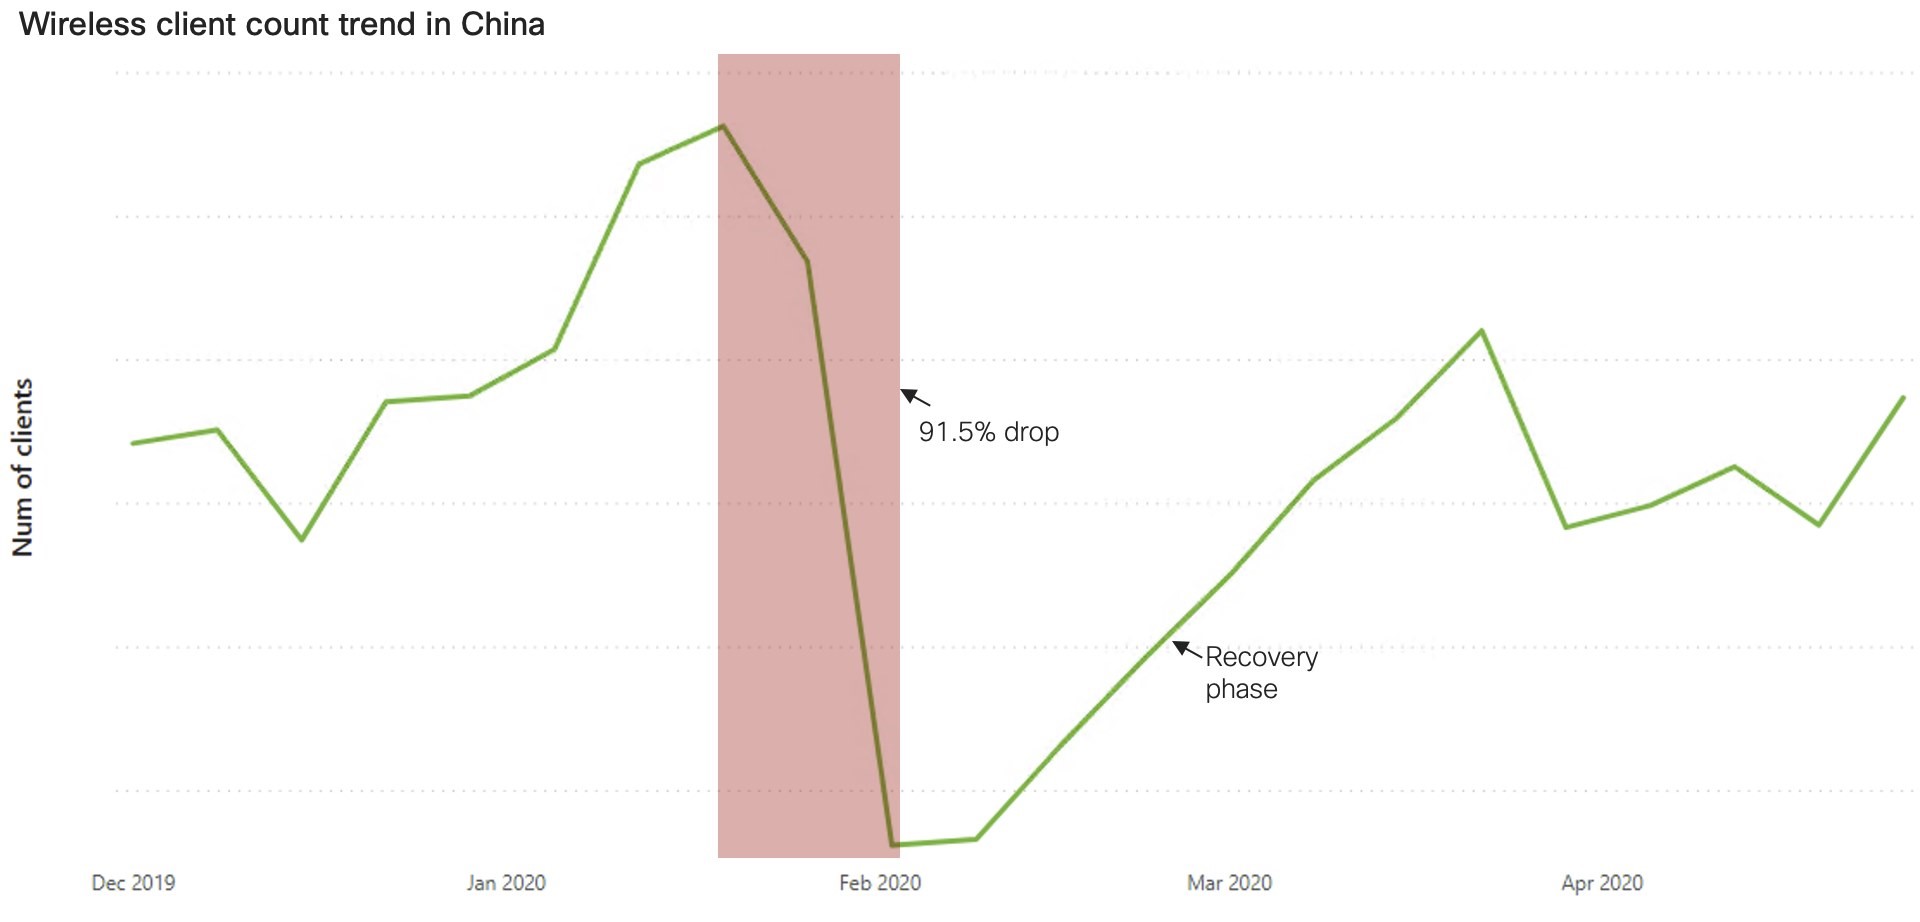
We observe that businesses in China started recovering much earlier than the rest of the world. And given the weekly increase in client count after the first week of February, the recovery seen in China appears to be quite aggressive.
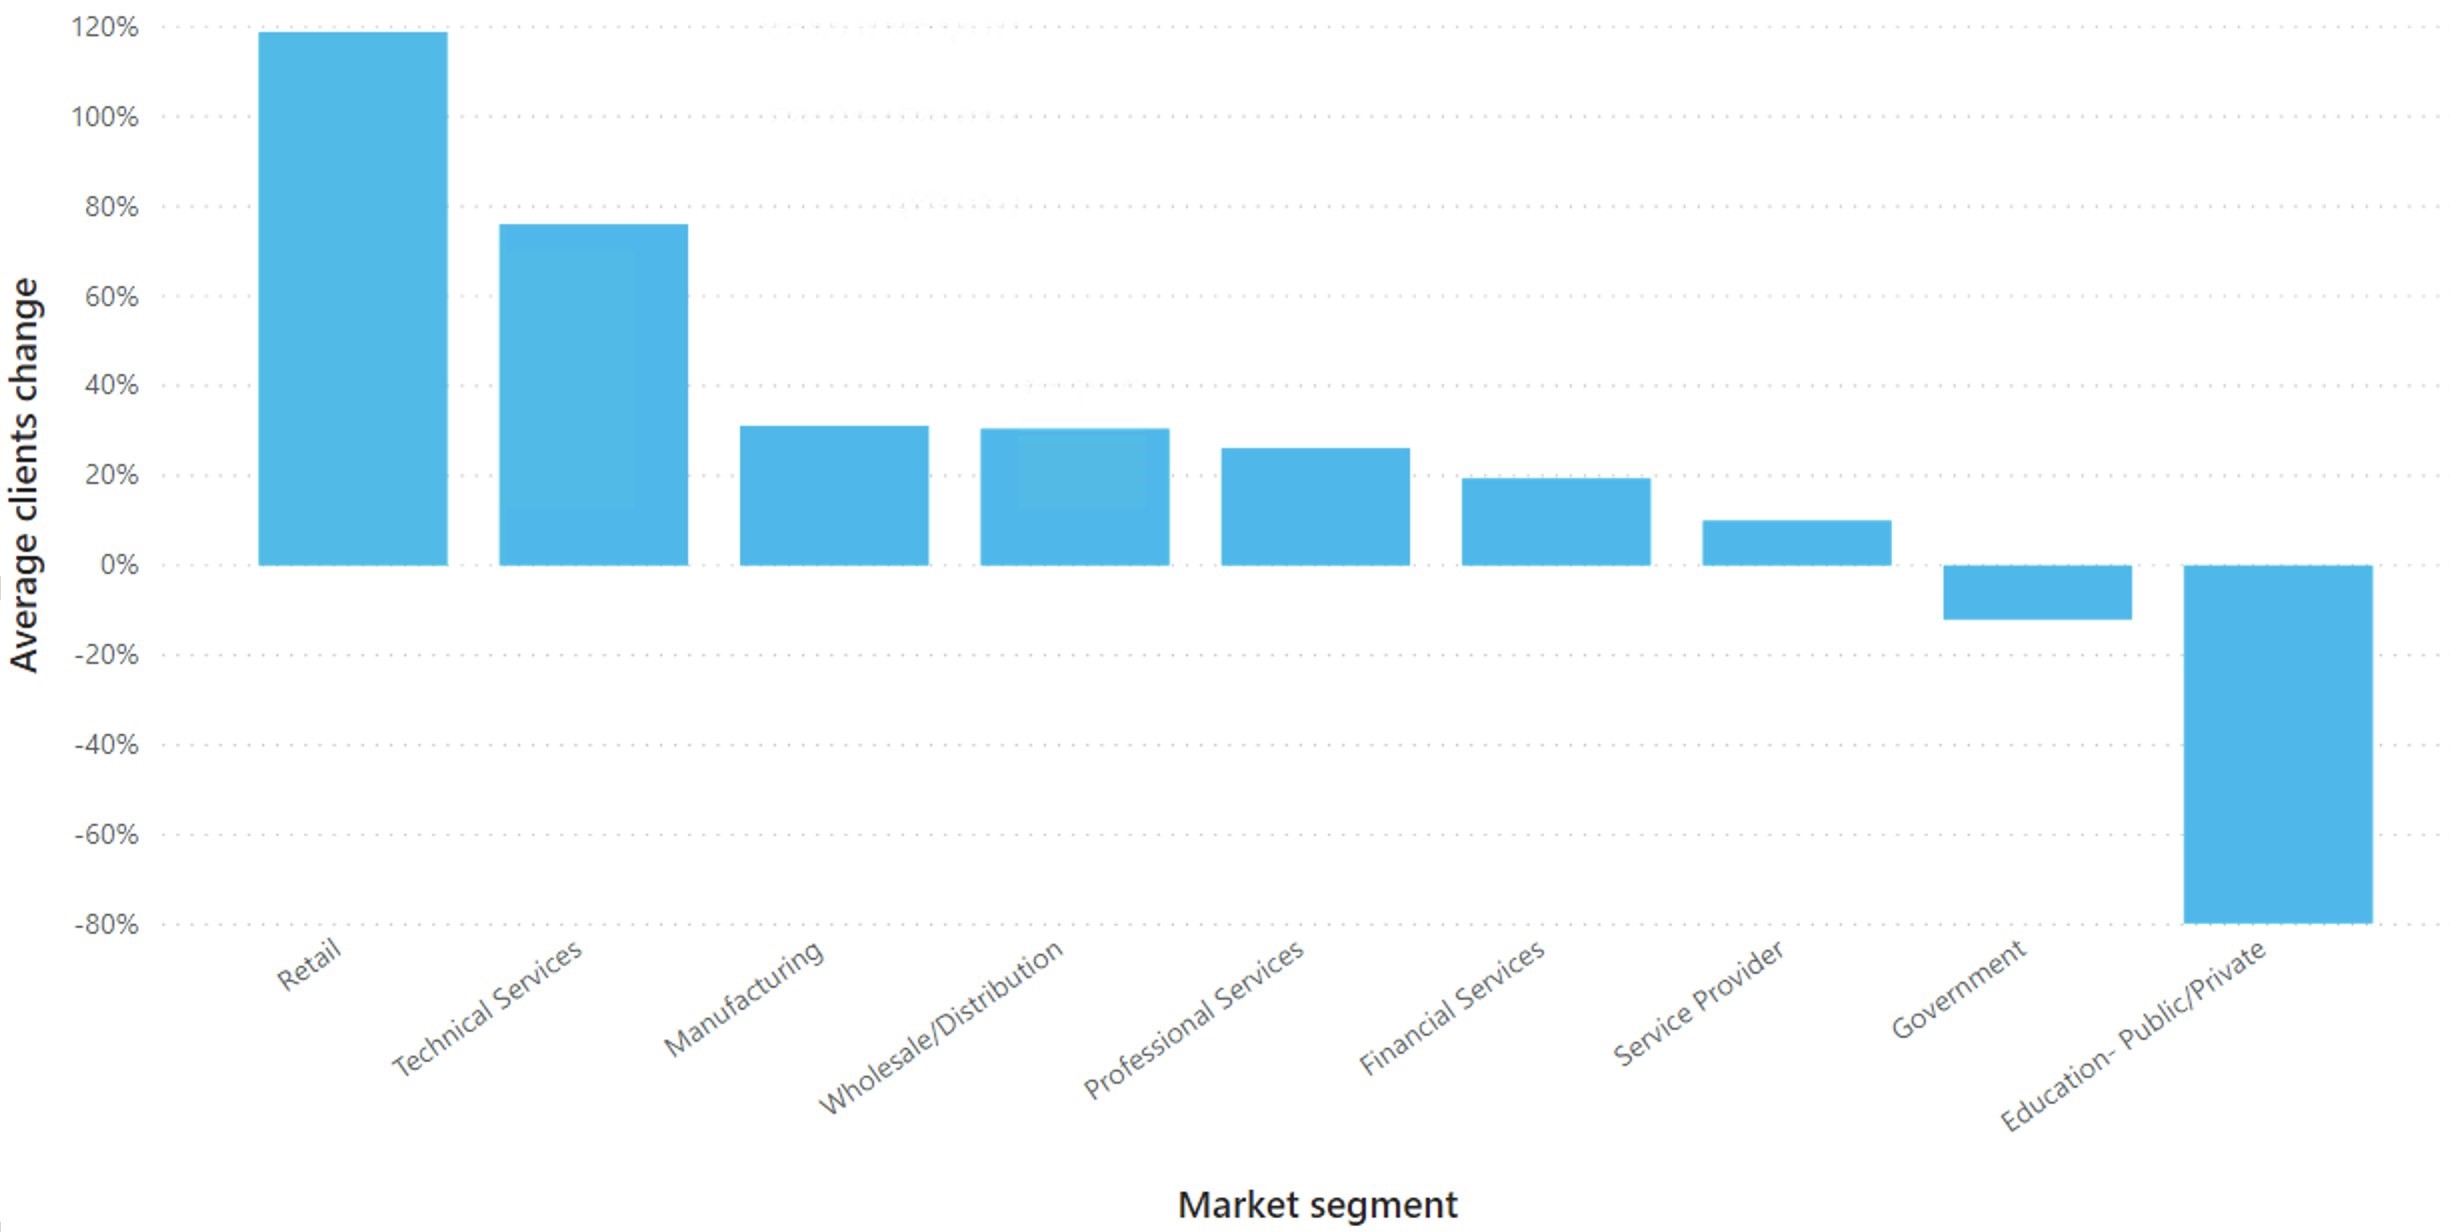
Looking at the change in client count (as of April 27) as compared to the historical average across the market segments, we can see that China is showing above average count in all segments except Government and Education:
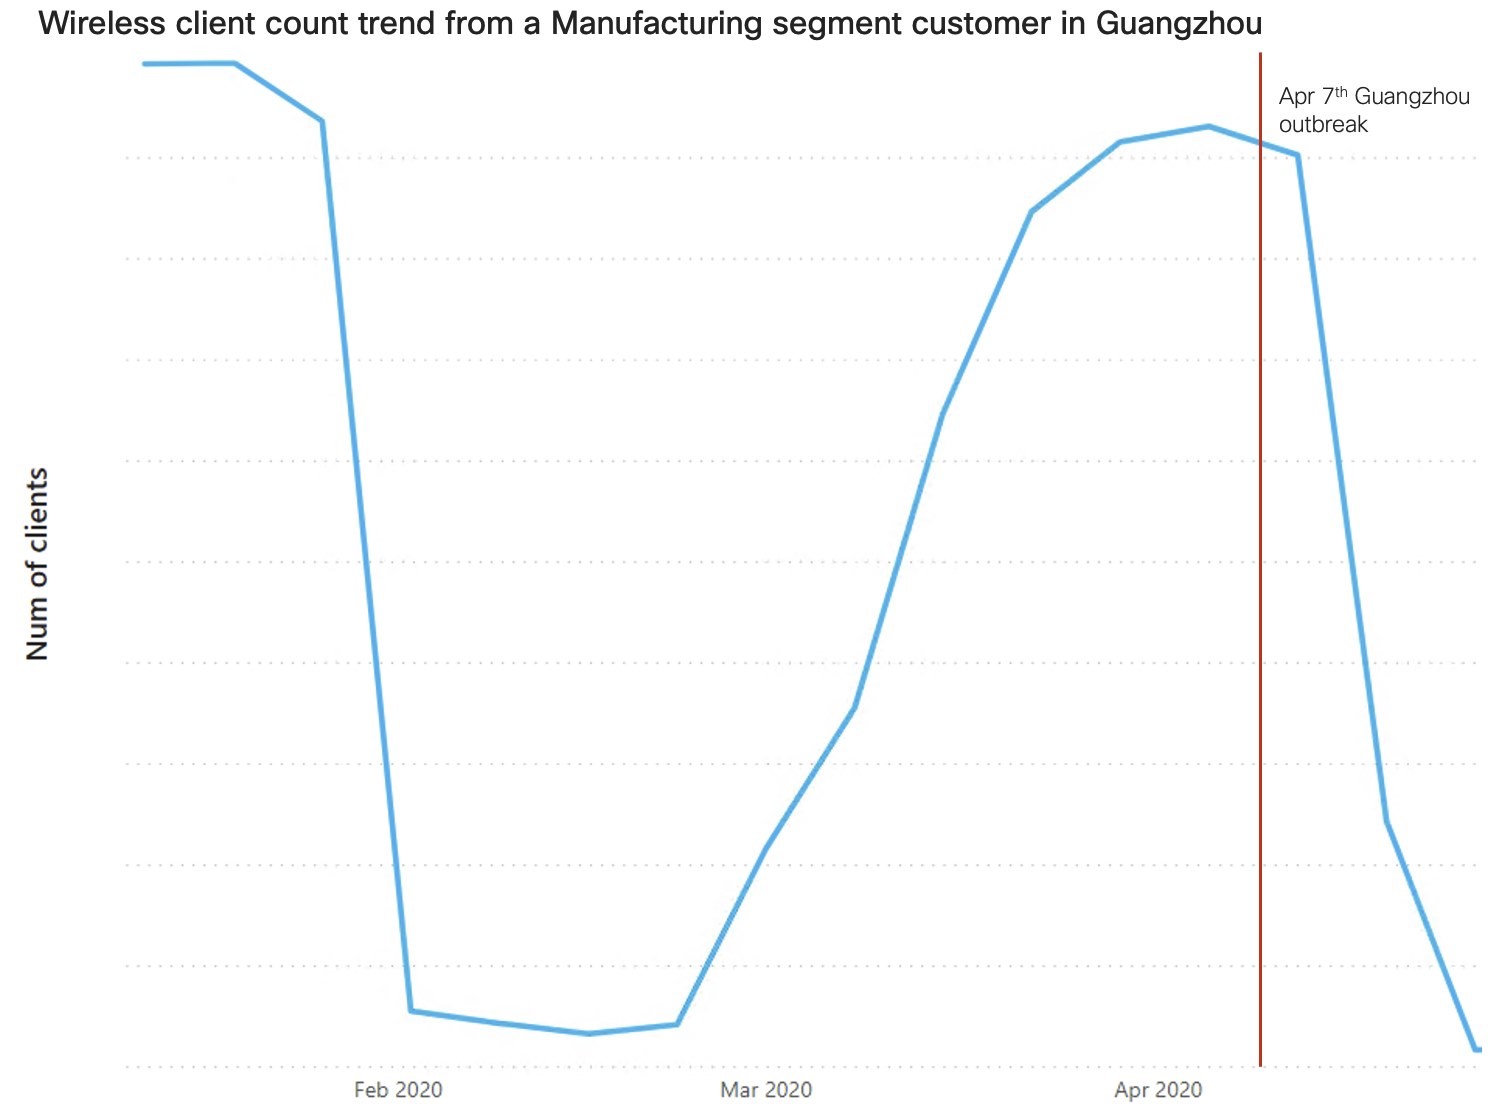
The Manufacturing segment in China showed an interesting trend. There are two dips seen in the client count trend for Manufacturing. The first dip is understandable — this is when the pandemic was at its worst in China. But the second dip (decline of 41.46%) unexpectedly occurred in April when China should have been out of this crisis.
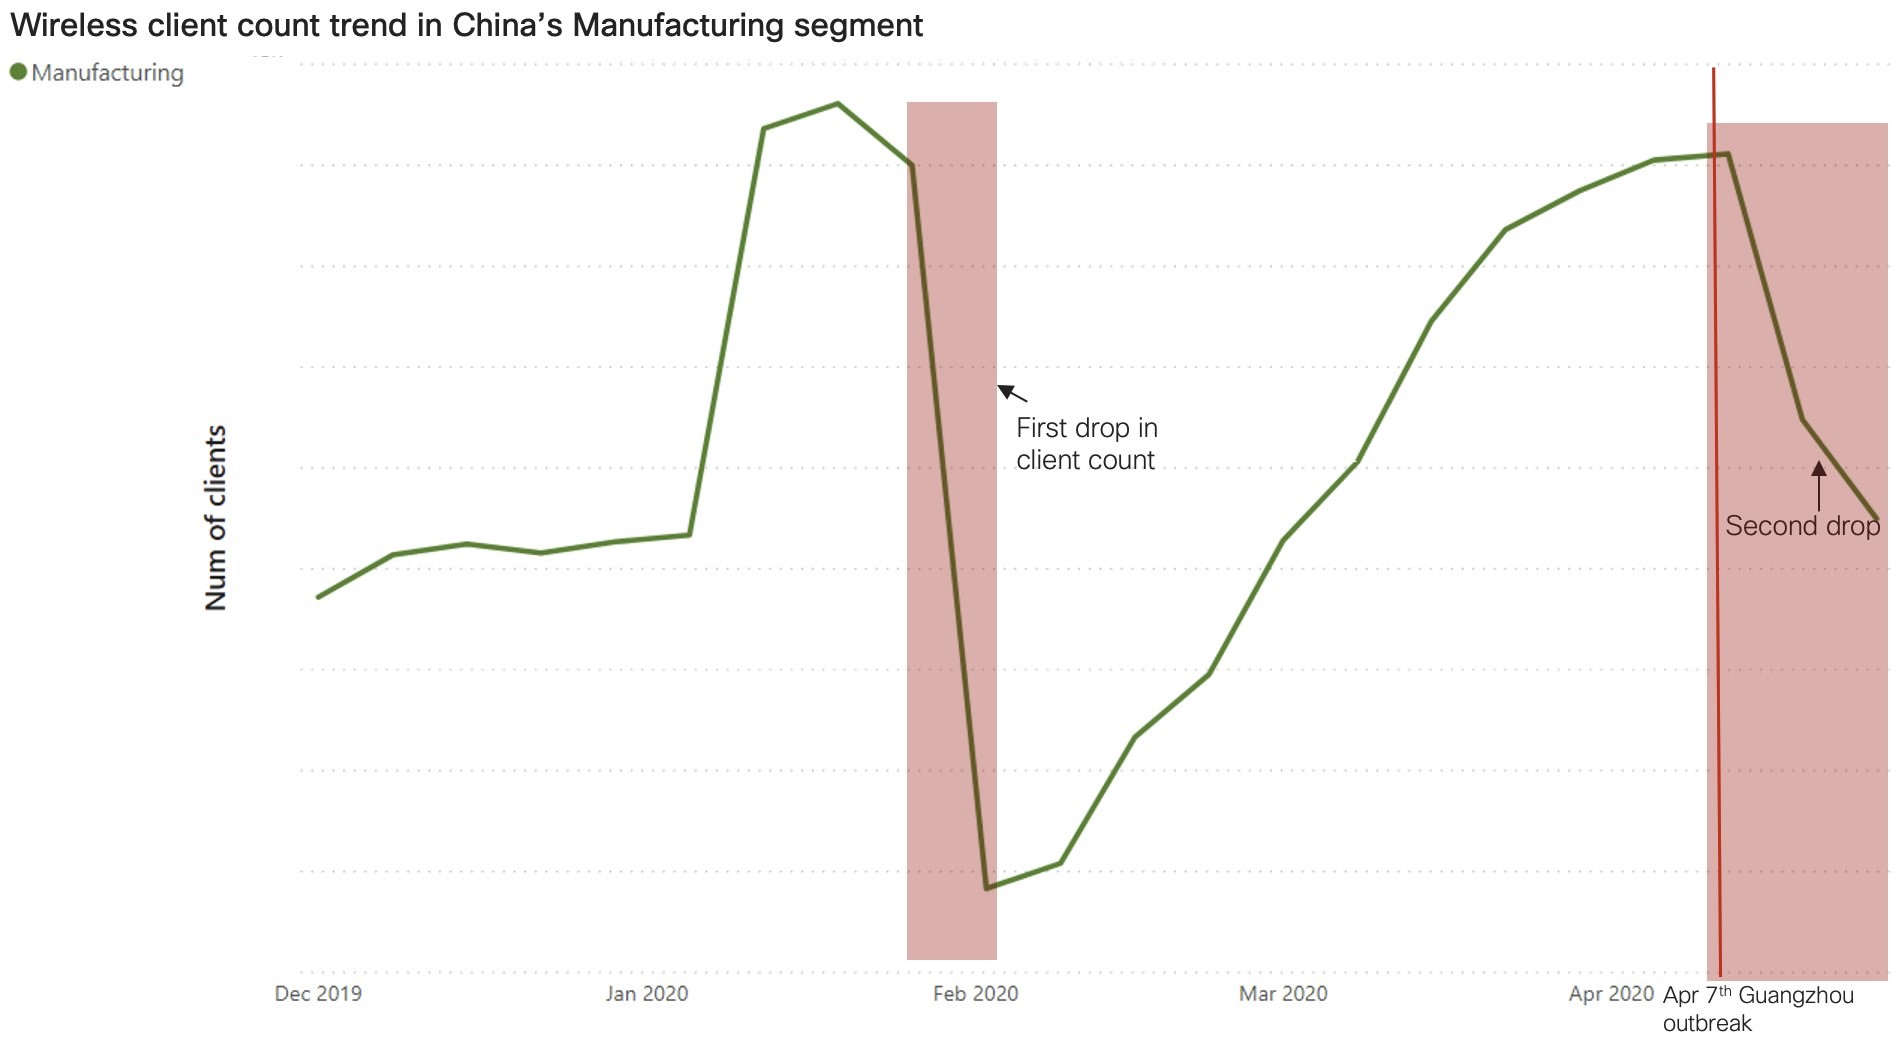
Looking at this a bit deeper, there is one customer from Guangzhou that had a much bigger contribution to the drop in the Manufacturing segment than the rest. The client count for this deployment dropped in April by 98.1% in two weeks and contributed to the overall drop for this segment. This correlates with the news of an outbreak in Guangzhou and the shutdowns in the region because of this localized outbreak.
Overall, looking at the trends of all the market segments, China is showing recovery.
United States
The United States started seeing the first few reports of the infection in January 2020. By March 13th, a national emergency was declared and a number of states went into lockdown after that. After more than a month of severe lockdown measures, a few states started to open up in a phased manner. Given this shifted timeline as compared to China, we should expect to see some interesting insights by analyzing the telemetry data.
In sharp contrast to China, the US shows a steep decline (54% drop) in client count in the second week of March. This correlates with the timeline of the response in the US because of closures and lockdowns on businesses occurred only in the second week of March.
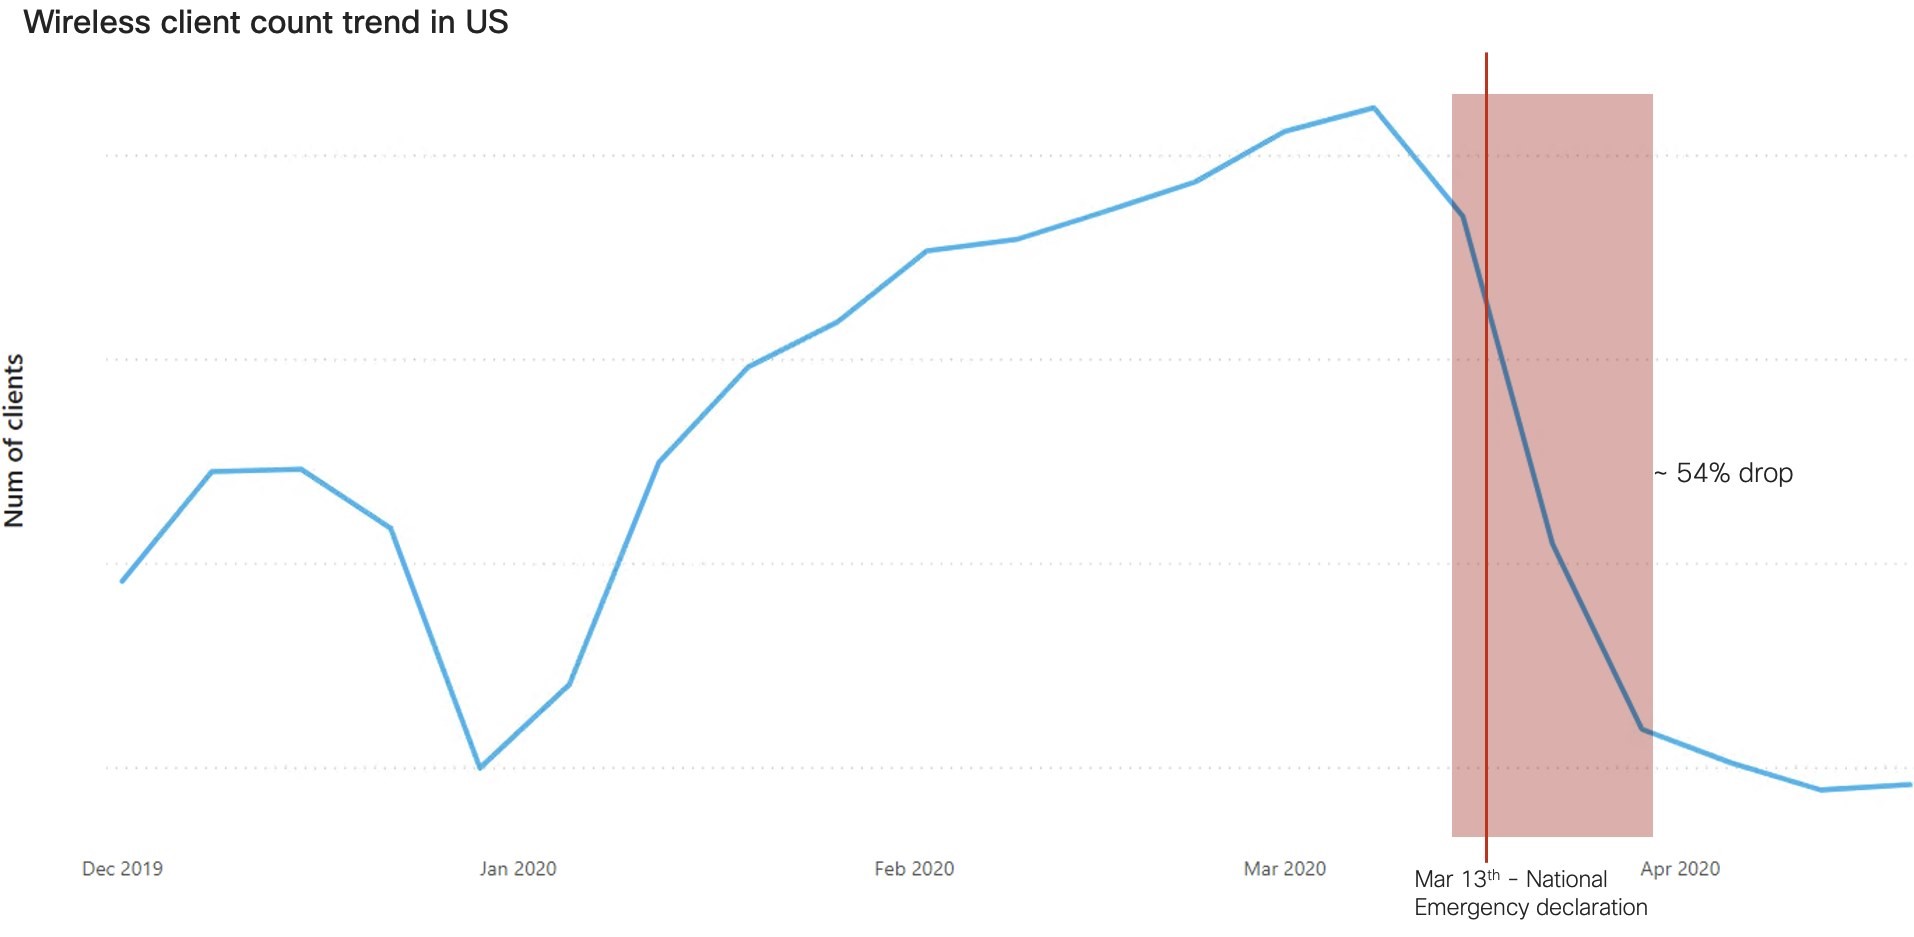
Beginning in April, the client count trend for the US showed some stabilization and a very slow growth in the last few weeks of April. This observation correlates well with the news about businesses coming out of the lockdown in a phased manner at the end of April.
Other than Healthcare, all of the market segments in the US are showing a client count below the average. With social distancing becoming the norm and schools and universities shut down, market segments like Hospitality, Media and Entertainment, Transportation and Education have been hit the worst.
Looking at the week-by-week changes starting on March 9, we can see steep declines in multiple segments. We see a bit of a stabilization when April begins and then after the second week we see a slow increase in client counts across different segments.
We observe that businesses in the US are slowly trying to come out of the lockdown. While it is not as aggressive as China, the progress is still happening.
While China is showing growth with its top customers, the customers in the US with the highest number of unique client counts are still showing decline in count in the last week (as of April 27th). Since most of the large customers (as far as unique client counts goes) in the US are from the Education segment, this is expected. Schools and universities may remain closed until much later this year, so the recovery in this segment will take time.
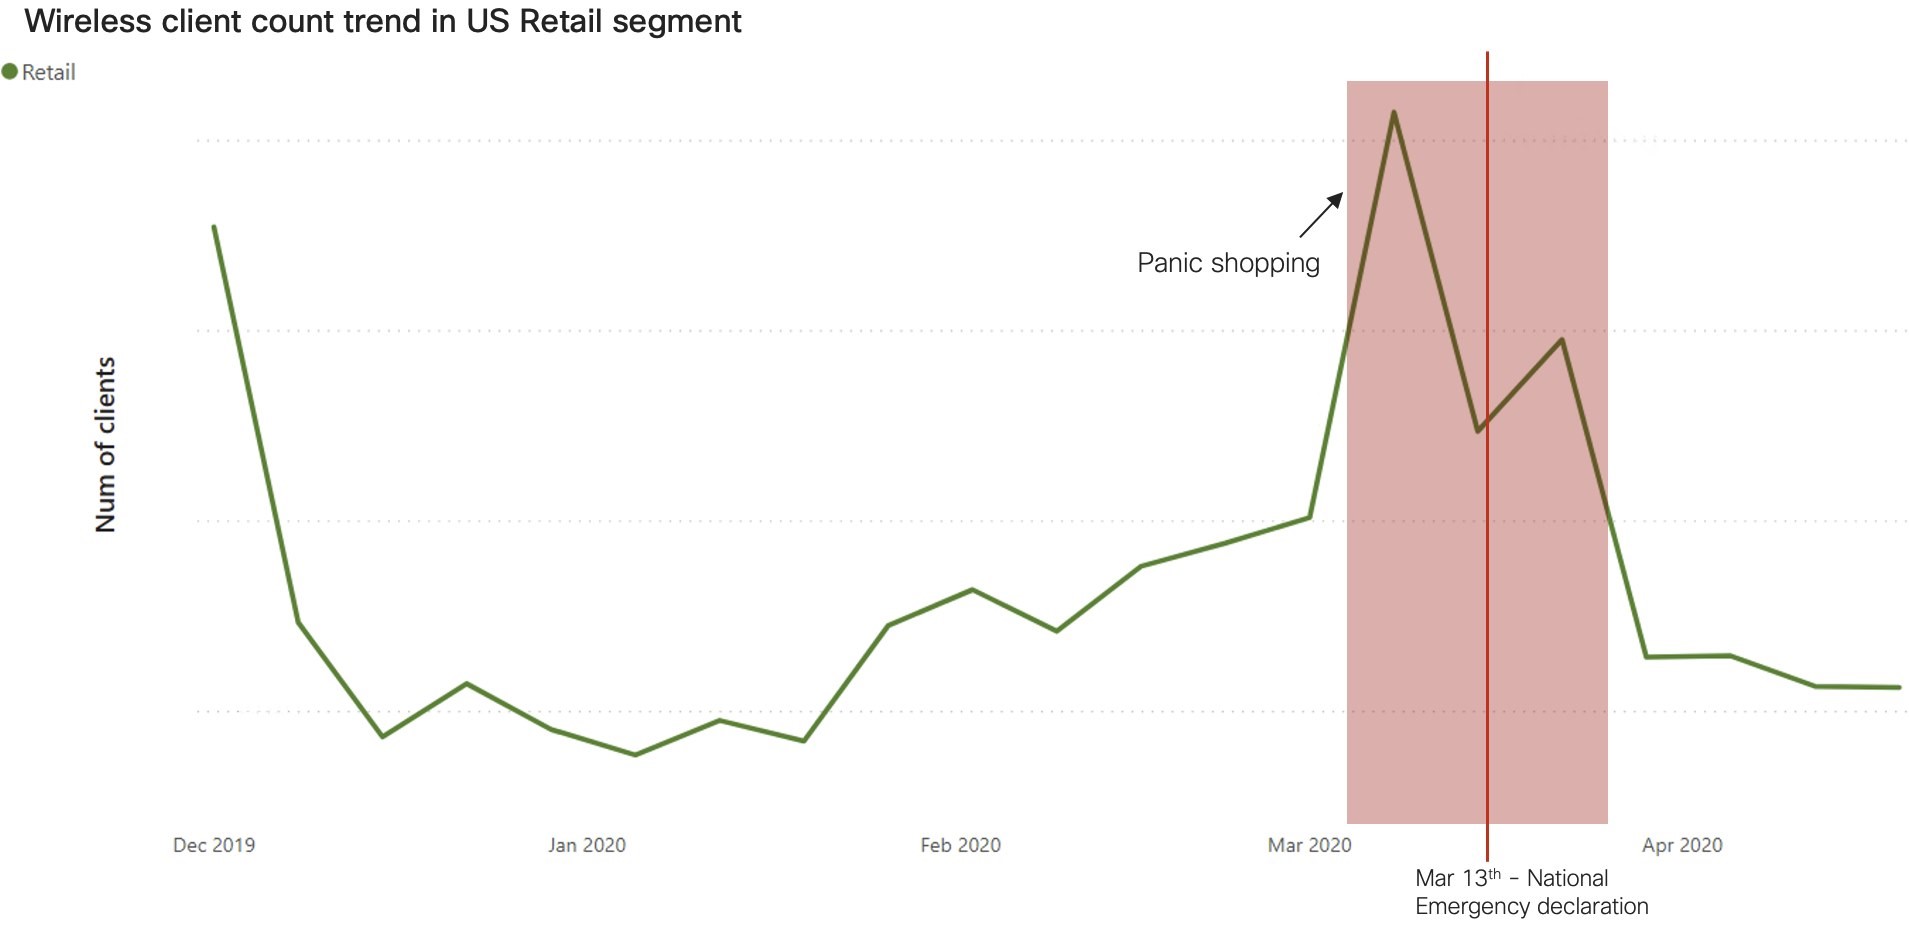
Retail has been an interesting market segment in the US to analyze. At the end of February 2020, the seriousness of the virus was first being felt in the United States. Infections spiked in Europe and the number of cases were rising in the United States. The fear of lockdown and running out of stock of essentials led to “panic shopping” in a lot of regions in the US. We can clearly see this phenomenon if we zoom into the retail segment in the US and check the client trend:
There are spikes seen in the client count trend for the beginning of March before the lockdowns in the US were announced. After that, near the end of March, the spikes died down, but the trend never really dropped very low. This is because grocery shopping is one of the essential businesses that had to be kept open.
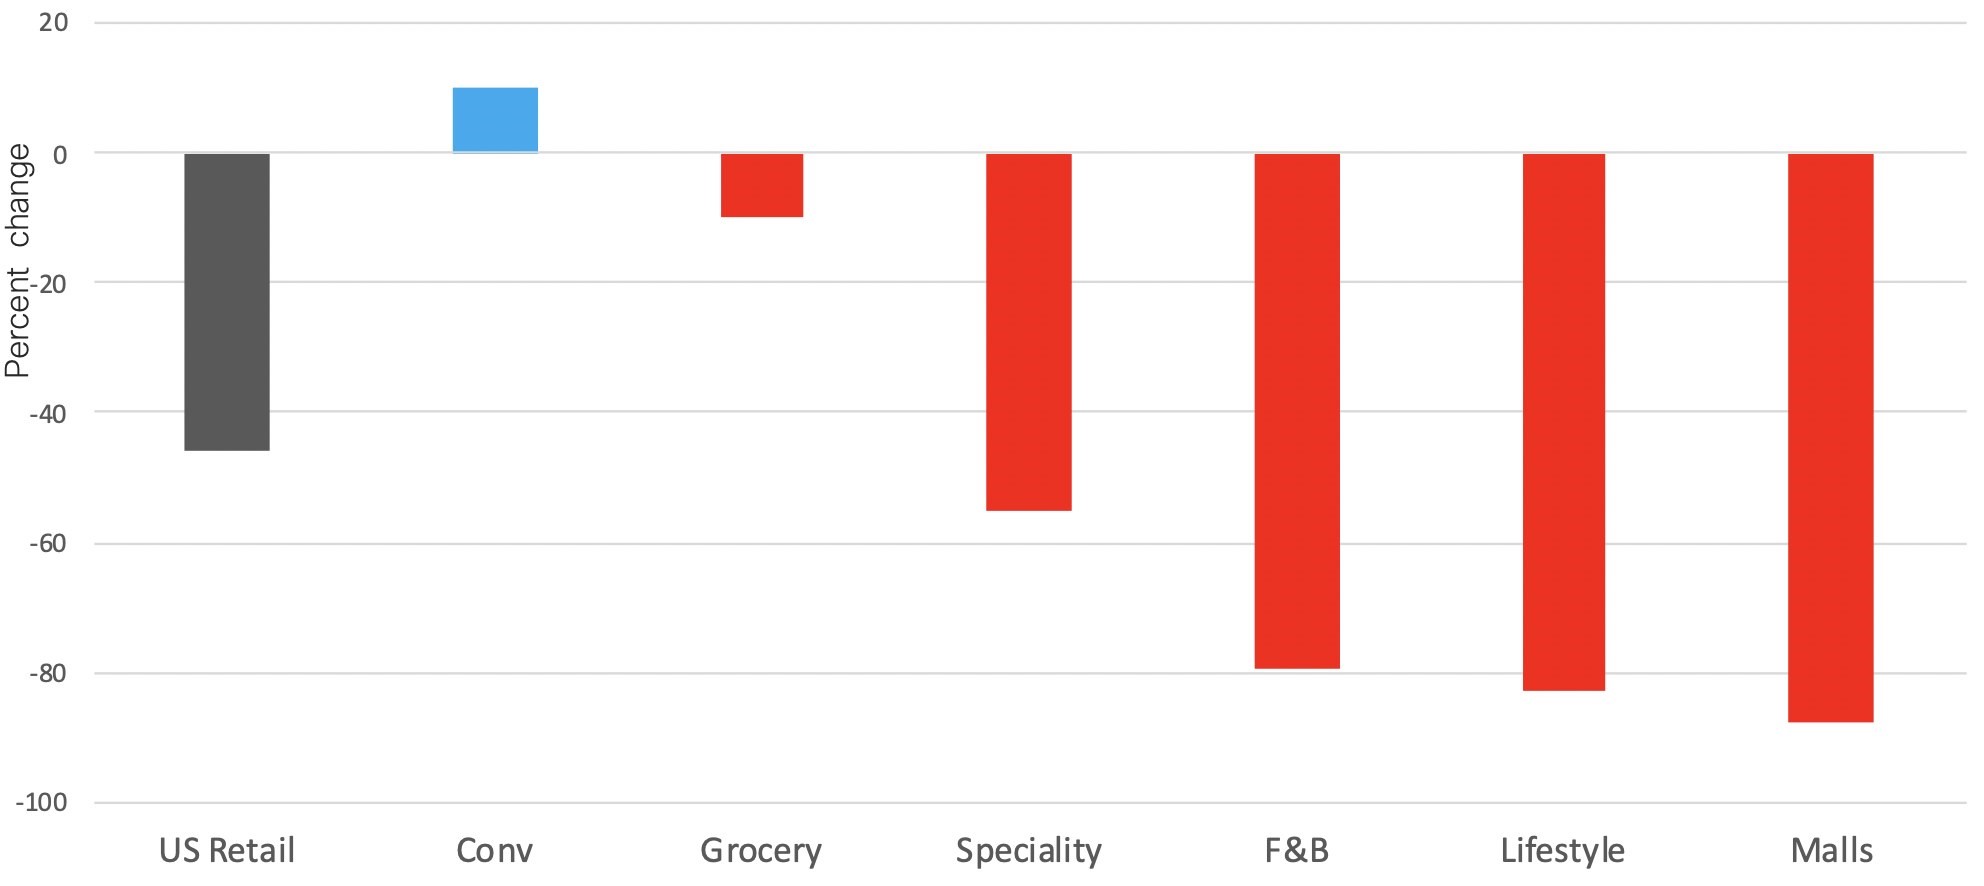
Diving deeper into the retail segment, Cisco DNA Spaces shows interesting insights into sub-categories in this segment.
By looking at percentage change in weekly visits across the sub-categories in Retail between first week of March and last week of April, we see that Convenience and Groceries categories were less affected than other categories.
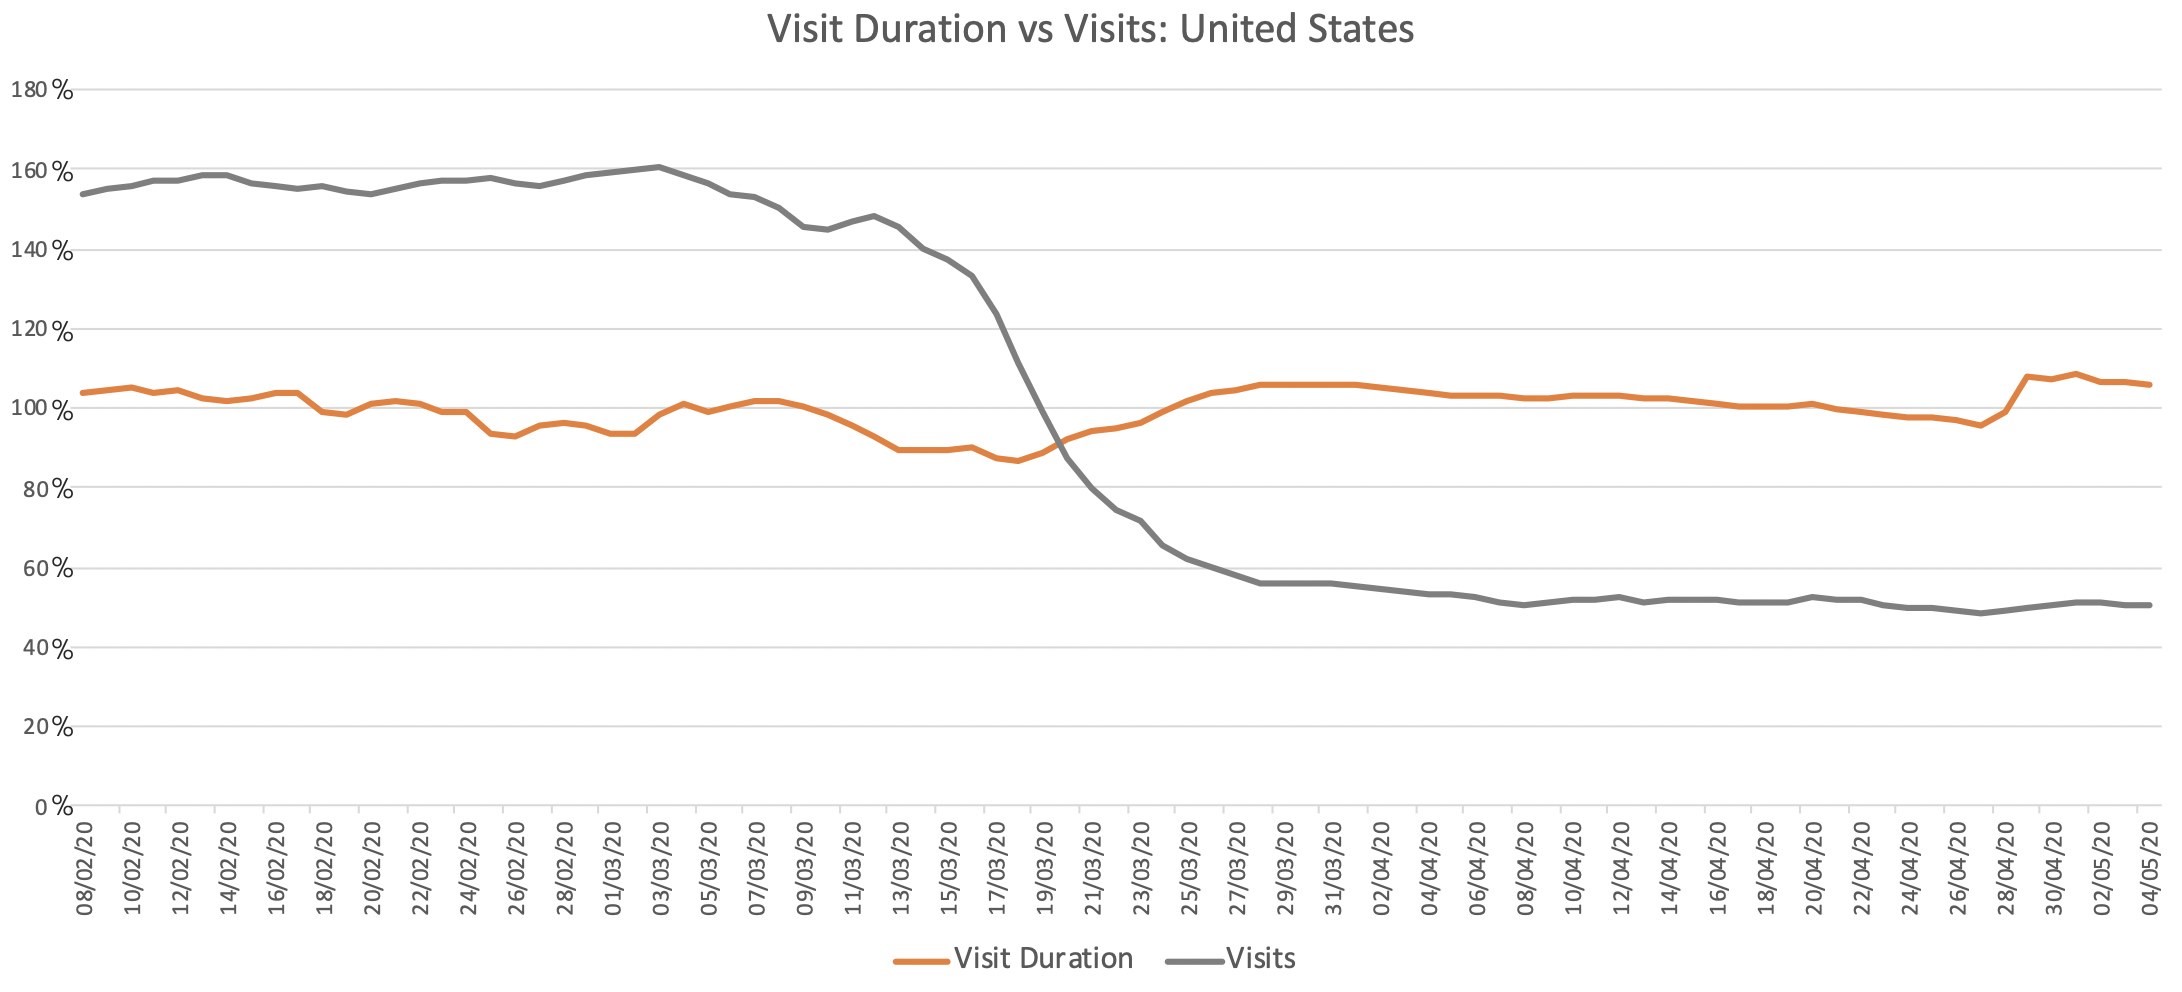
We also observe that while the number of visits to retail outlets have fallen during this crisis, the time spent by shoppers per visit to the store has remained largely stable.
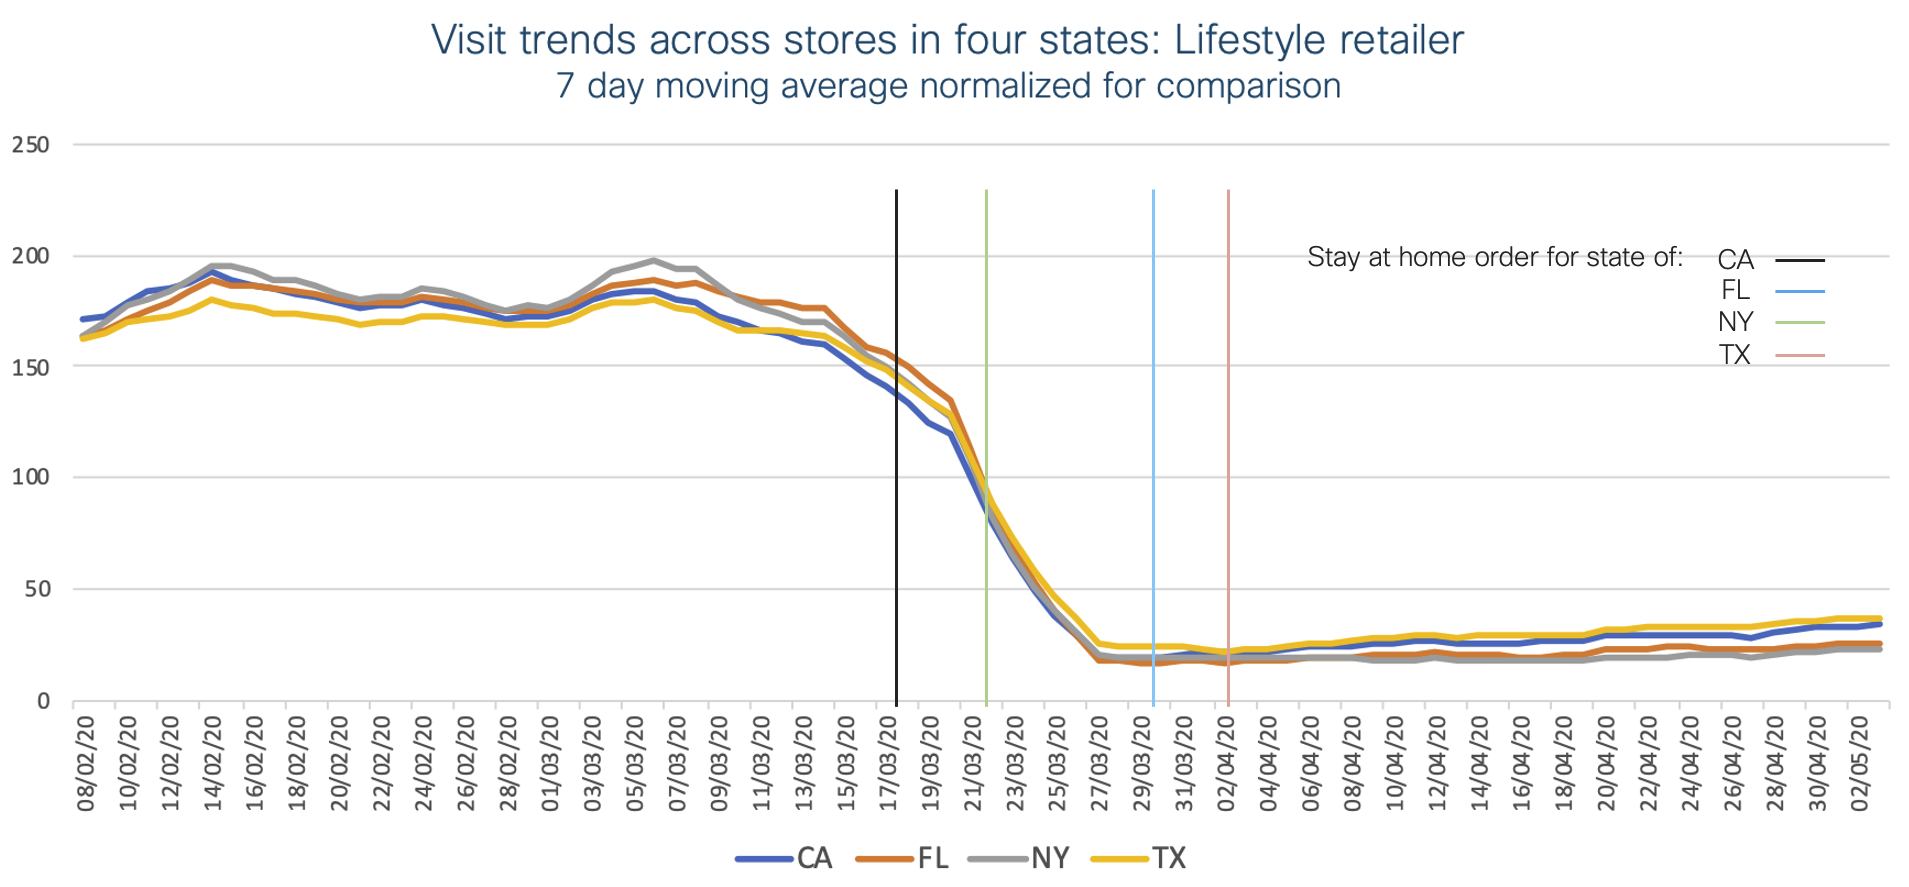
Another interesting observation in Retail segment is that the drop in visits by customers was agnostic to local social distancing regulations. We looked closely at the visits data from a Lifestyle retailer with stores across four states – California, Florida, Texas, and New York. These states announced shelter-in-place orders at different times and the level of restrictions were also different, but the timing and pattern of decline in visits was identical across all the locations.
Sweden
Sweden, the country that adopted the unique and controversial approach to stopping COVID-19, kept most of its businesses including primary schools and non-essential businesses open while encouraging people to work from home if possible. It relied on ‘herd immunity’ to stop the transmission by letting the stronger population get infected and develop immunity while protecting the high-risk population. What does the data tell us about the impact of this pandemic on Sweden, and on its businesses as a result of this unique approach?
Unlike most of the other countries impacted by the pandemic, Sweden had very minimal impact in the month of March and it shows very aggressive recovery in the last week of April:
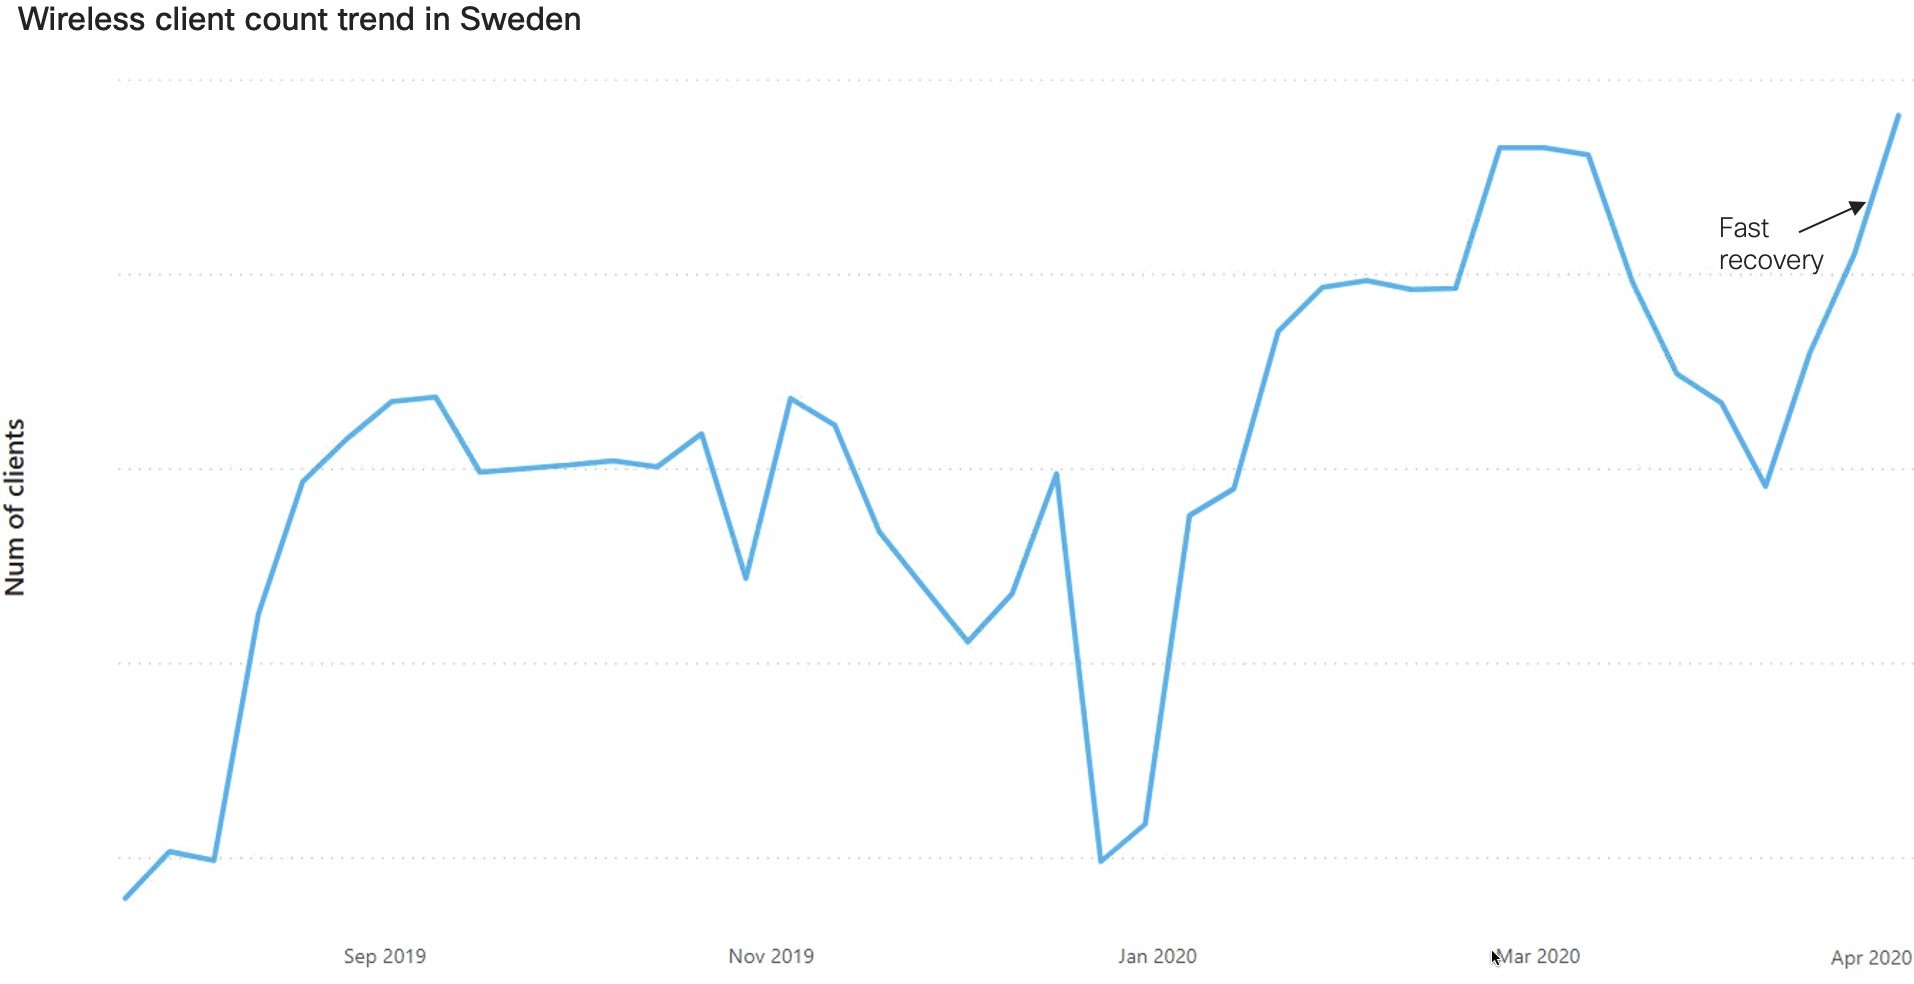
In the last few weeks of April, the EMEAR region has shown the fastest recovery (49.43% growth in client count since 2nd week of April) when compared to AMERICAS (+5.58%) and APJC (+3.22%). And within EMEAR, if we take a snapshot of the top few deployments with highest client counts, most of them are from Sweden, and the count is higher than average in the last week of April:
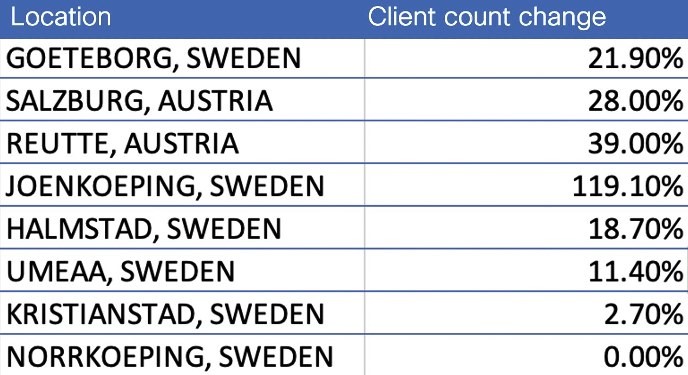
This makes Sweden kind of an outlier as compared to the other Nordic countries and it could be attributed to their unorthodox approach.
India
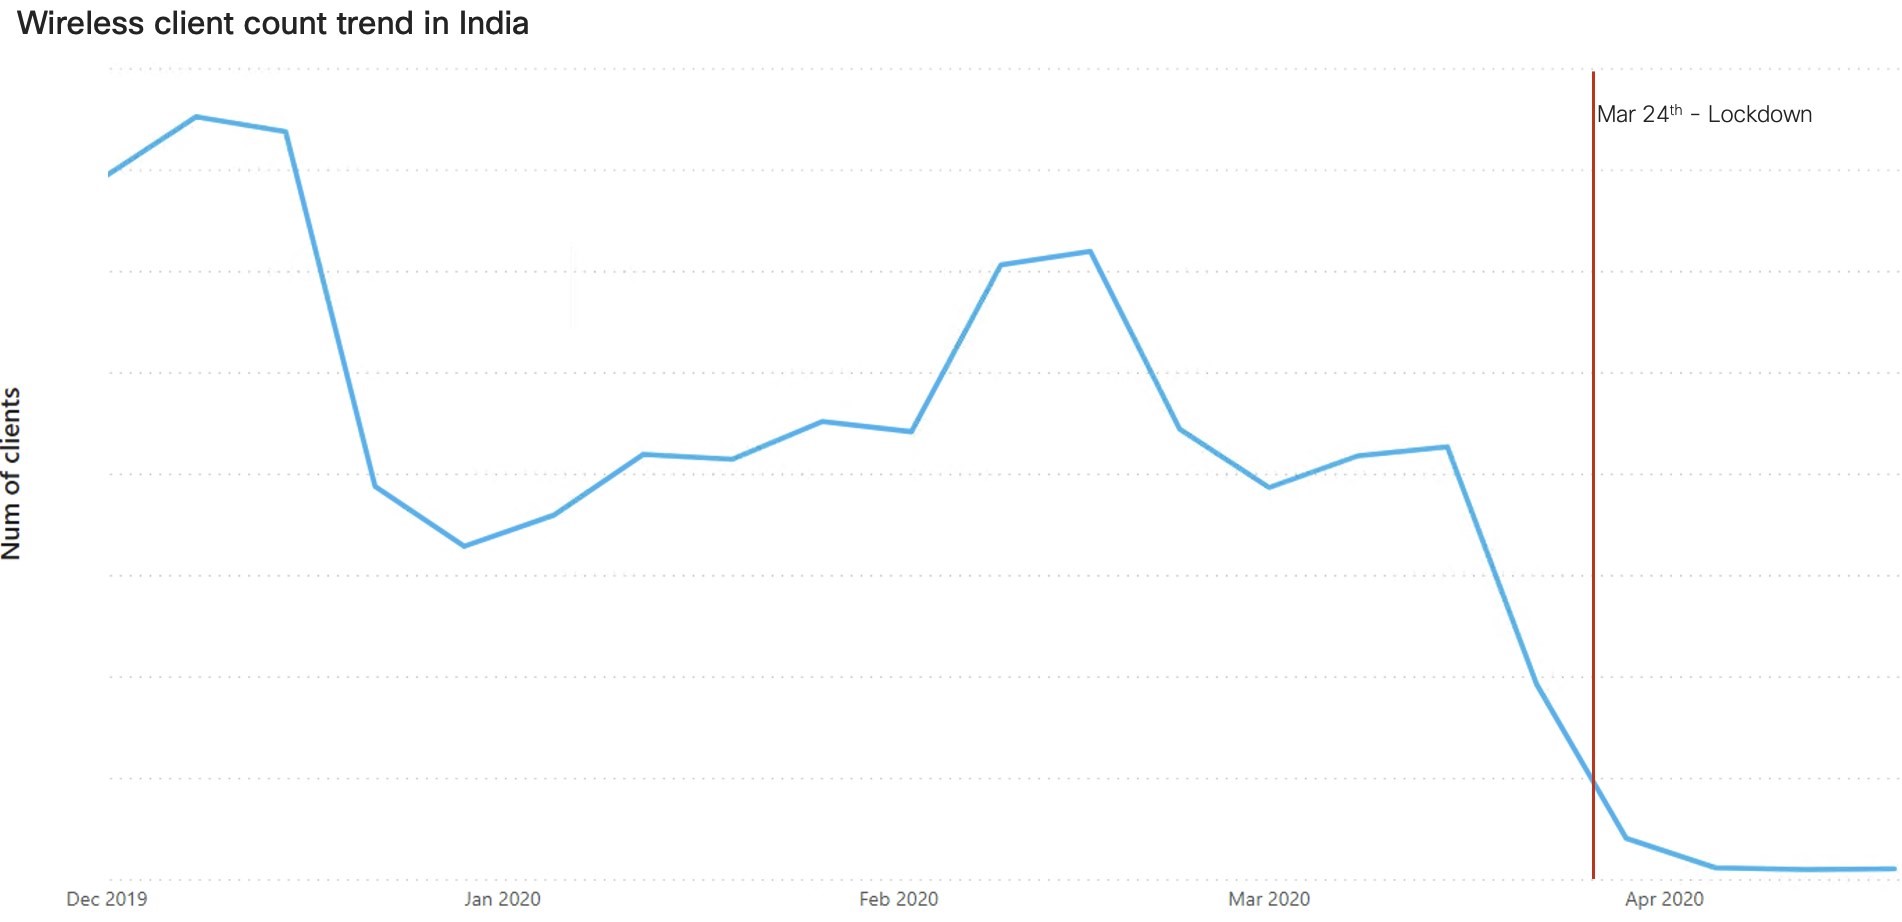
On January 30, 2020 India reported its first case of the virus. By mid-March the number of confirmed cases escalated to more than a 100. The government started imposing travel restrictions and states began to issue shutdown orders or asking institutions to work in limited capacities. Finally, on March 24, the government issued an order for complete lockdown of the nation.
This sequence of events can be seen in the overall client trend for India. After the second week of March, there is a rapid decline (a drop of 95.97%) in client count and it bottomed out at the end of March. This is in line with the earlier observation where globally user presence dropped suddenly. After the steep drop, the trend line has remained flat:
The Government of India and all the State Governments took strict measures to make sure no one violates or defies the lockdown restrictions. All market segments were severely impacted because of these stringent measures exercised by the government:
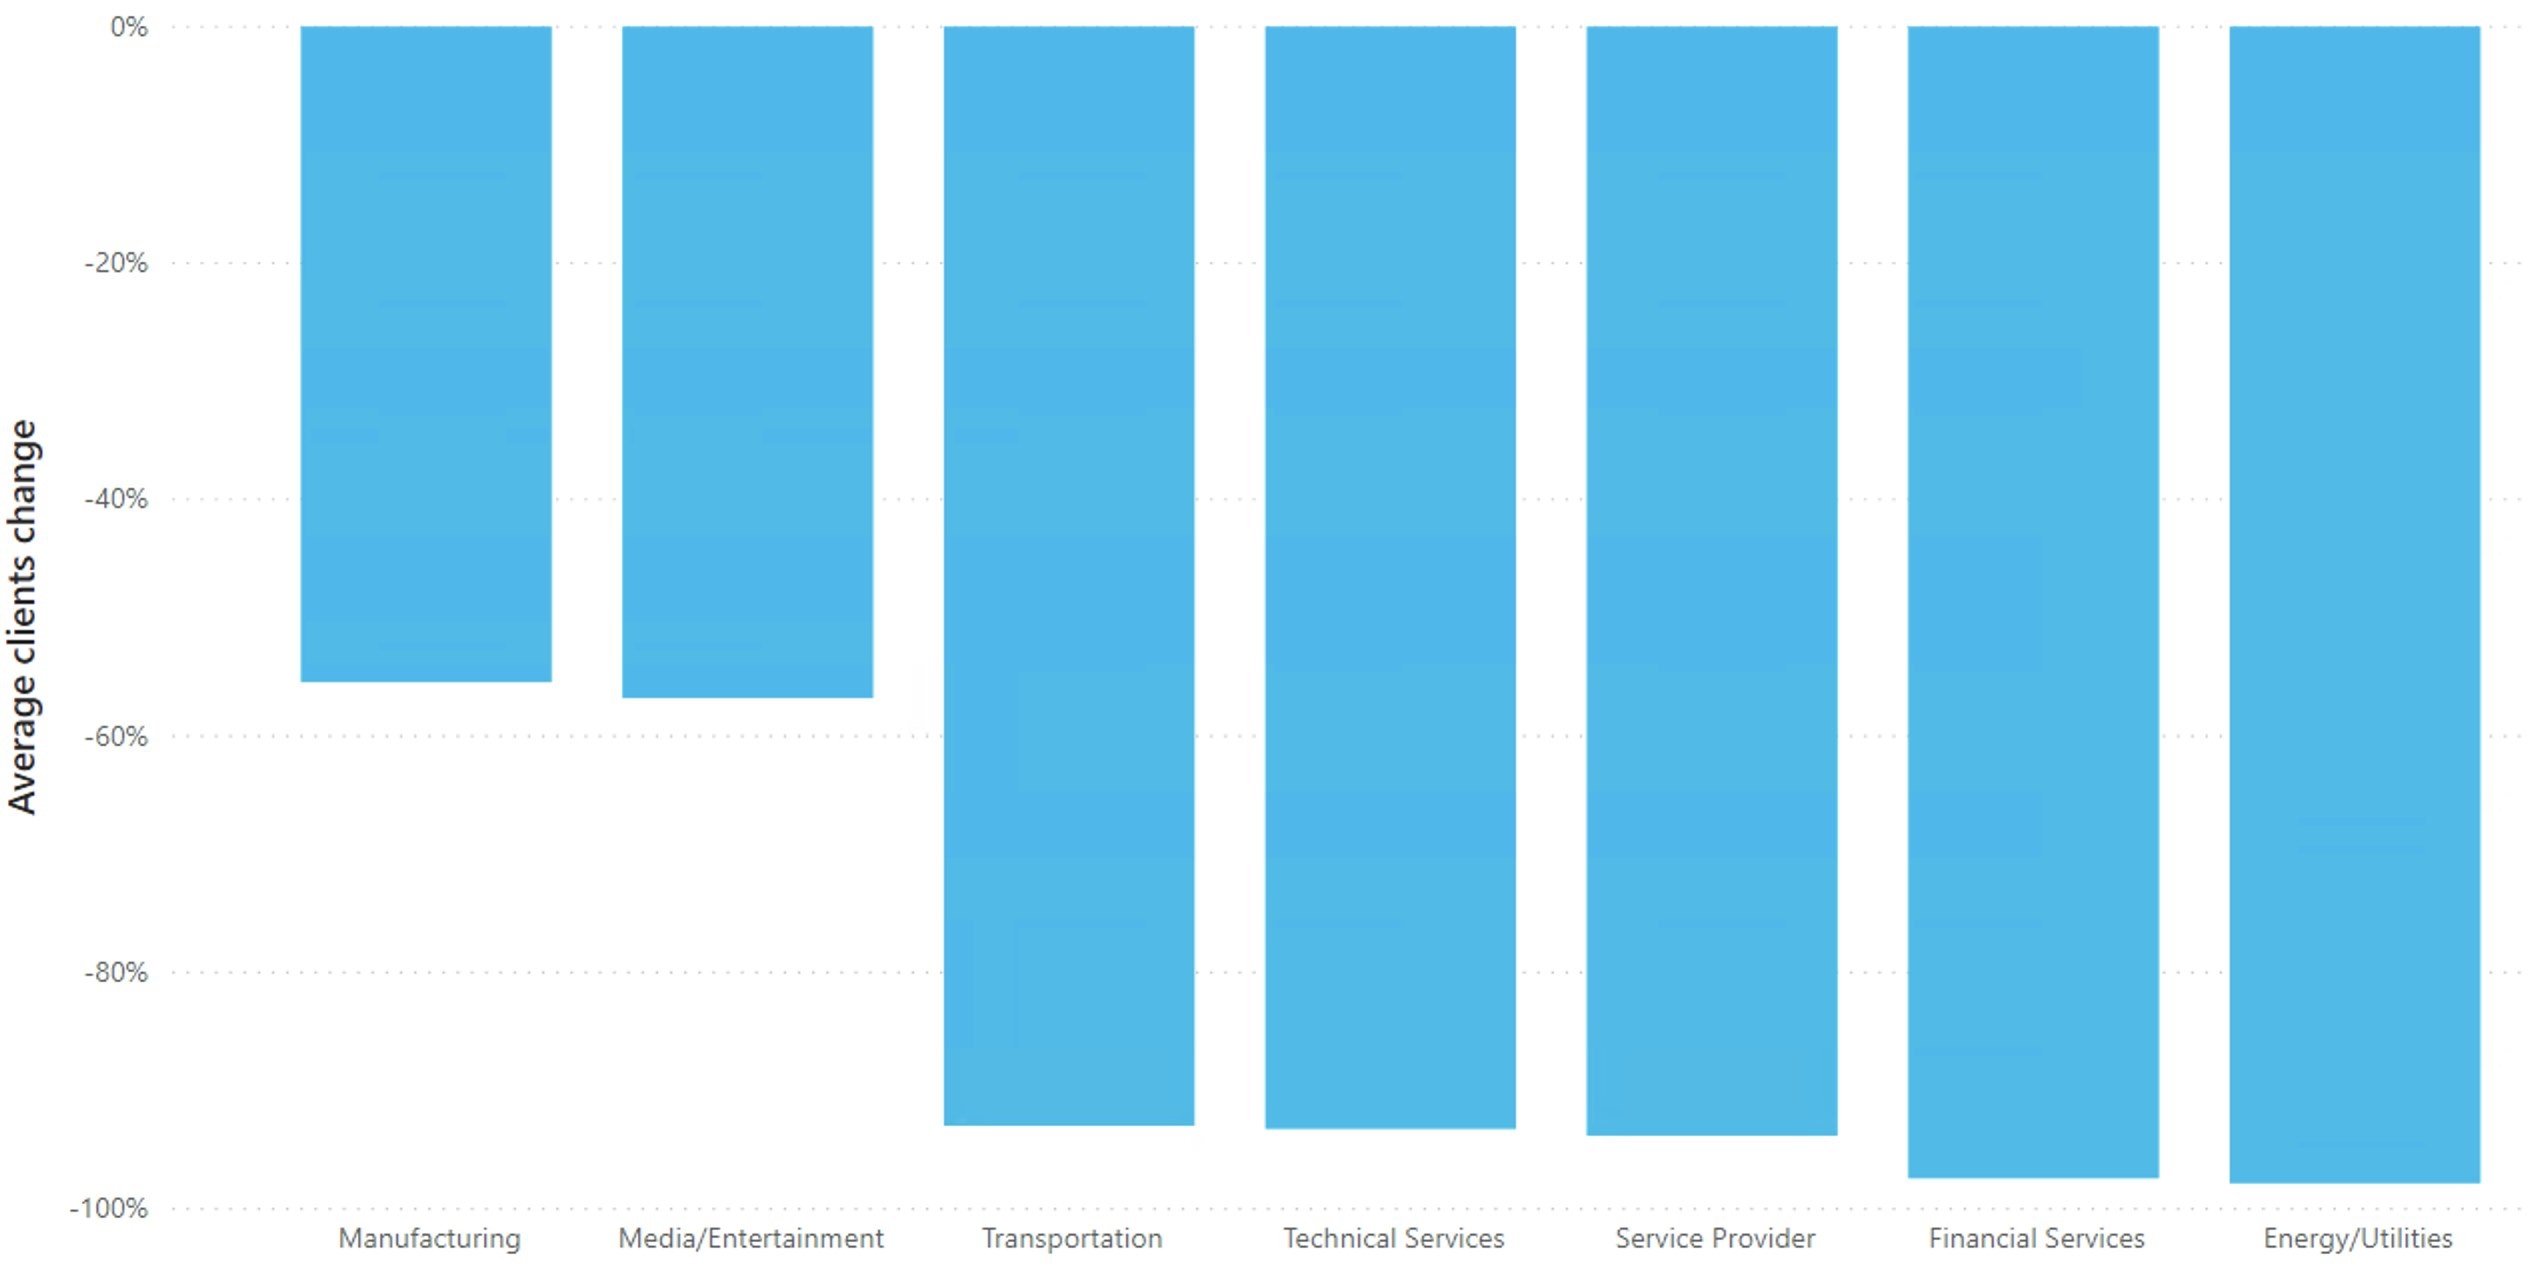
A week-by-week analysis shows that user presence in some segments like Technical Services had already started getting significantly impacted starting mid-March.
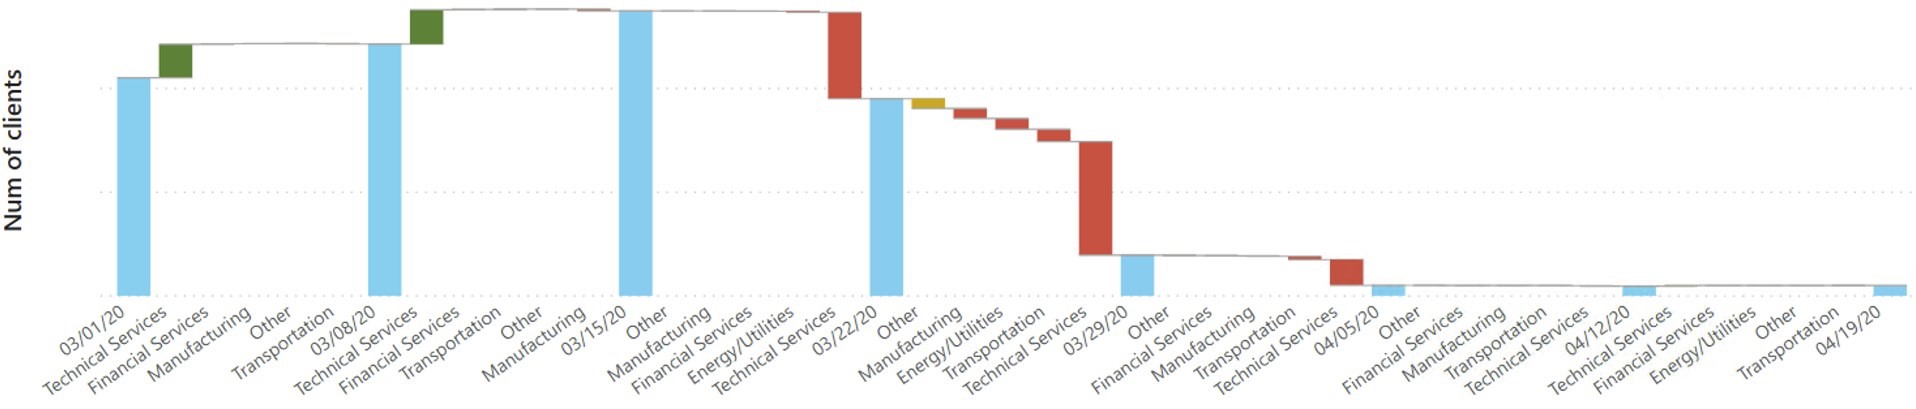
There is an explanation for this observation. Out of an ‘abundance of caution’ a lot of employees had already started working from home. Multi-national companies were asking their global teams to work from home even before the Government of India announced the nationwide lockdown because of COVID-19.
One can also notice that after March 30th, there has hardly been any change in the client count. This can be attributed to the fact that the lockdown restrictions are being strictly enforced in India with legal actions taken against violators.
Conclusion
With the extensive anonymized data collected about Cisco’s wireless deployments around the globe through Cisco DNA Center and Cisco DNA Spaces, we can identify unique real-time insights into our customer’s deployments that will help businesses measure the impact this crisis has had across different regions, market segments and verticals. Such insights help industries to rearrange their priorities and develop new innovations to address blind spots that have been uncovered. The ability to capture, analyze and correlate data from millions of devices allows Cisco to help its customers answer complex questions about their business and better prepare for any future crisis.
Resources
Learn more about Cisco DNA Center and Cisco DNA Spaces
Subscribe to the Networking blog