
Hybrid work has made collaboration apps the critical link between remote workers and office meetings. Cisco DNA Center has new AIOps innovations for both Webex and Microsoft Teams that can proactively optimize the user experience for these applications.
The unprecedented shift to hybrid work has made collaboration tools like Cisco Webex and Microsoft Teams critical productivity enablers for office operations. In addition to this, many partners, vendors, and customers now prefer video conferences over in-person meetings since much of their staff may be working remotely. Businesses now depend on collaboration software for most of their communications, both internal and external, and thus they require top performance and absolute reliability from these systems. This means that troubleshooting collaboration application performance issues have become a top priority for IT. The latest Cisco DNA Center release delivers AIOps innovations that allow IT teams to quickly troubleshoot network issues that are affecting the performance of Webex and MS Teams. More importantly, they also provide tools to proactively optimize the network in areas where these apps are struggling, so teams can keep ahead of issues instead of chasing them.
The Cisco DNA Center Application Experience Dashboard
You may already know that Cisco DNA Center has a dashboard dedicated to application experience, which follows critical applications and the minimum parameters acceptable for KPIs. Users can customize the apps and parameters, but collaboration apps, including Webex and MS Teams, are set up as critical by default.
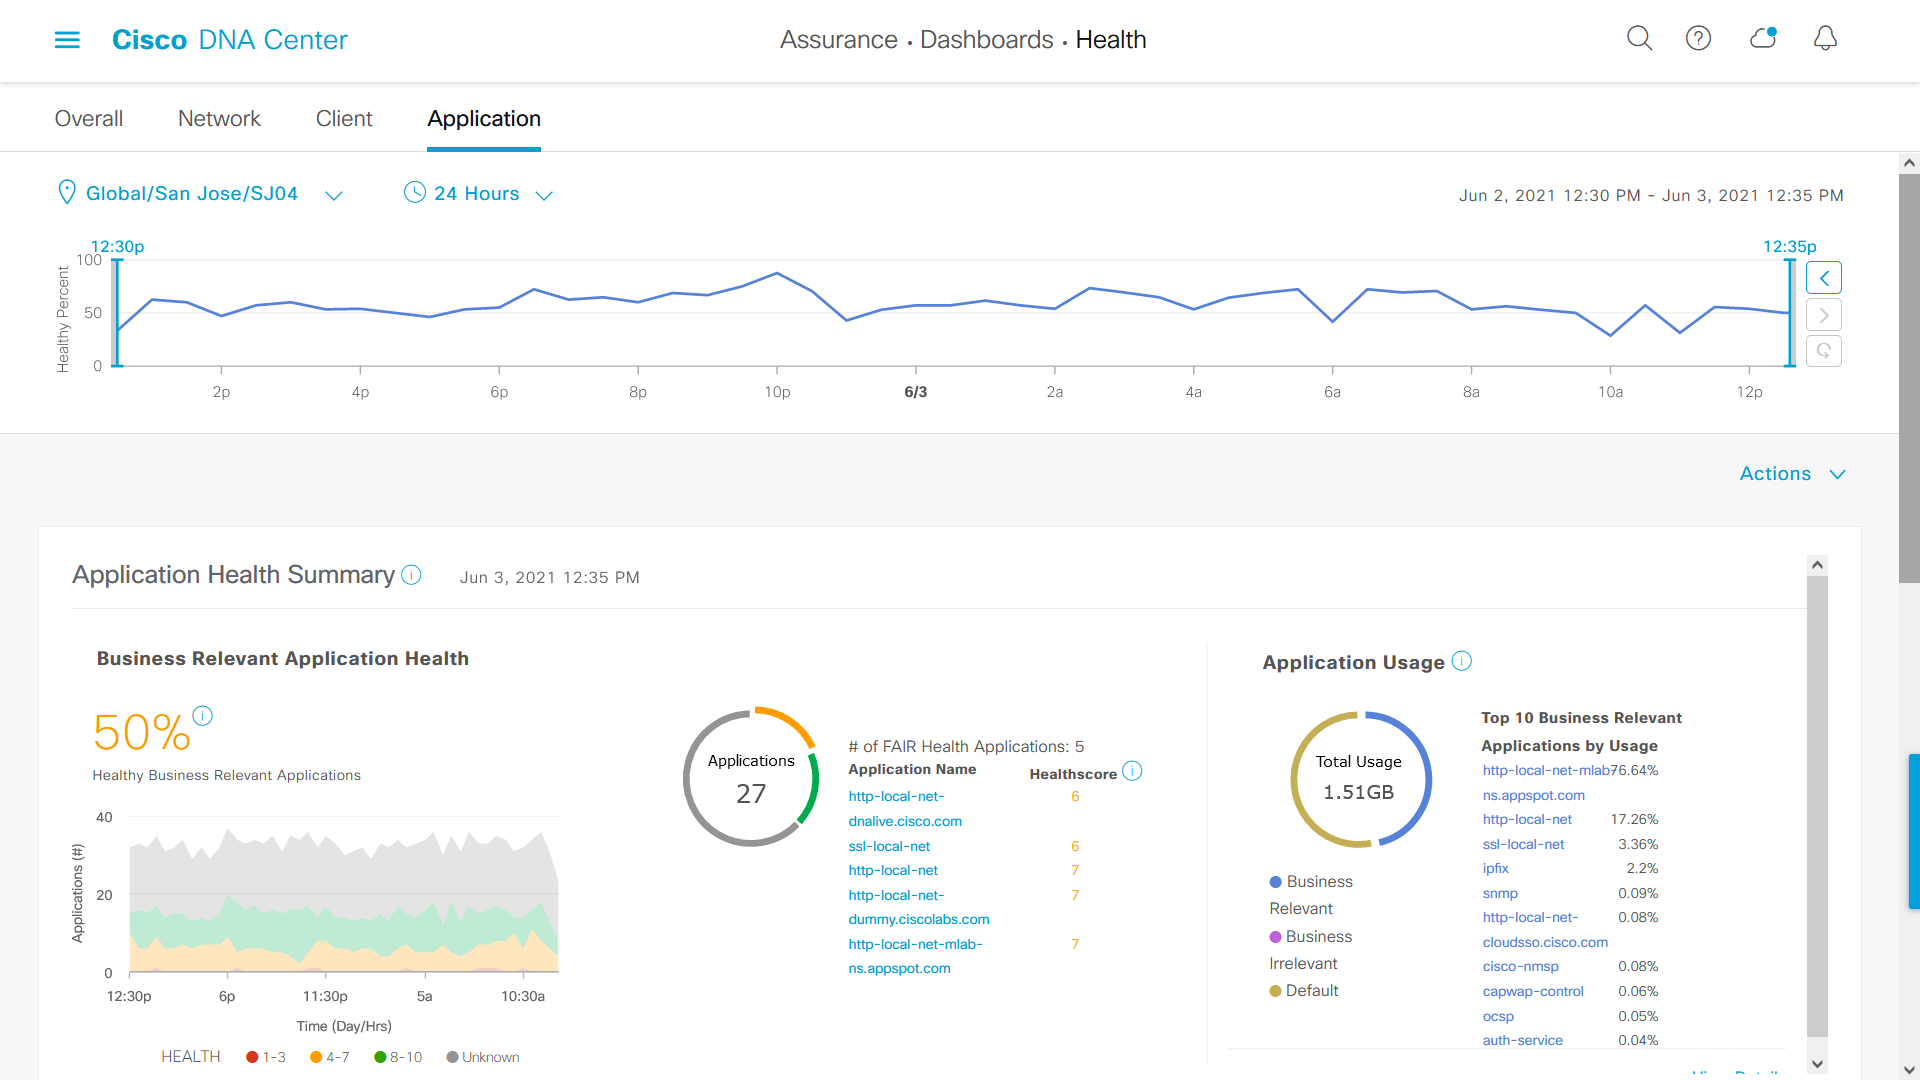
The top graph shows the last 24 hours of overall application health, and this can be extended up to 14 days, should you want to troubleshoot a specific event in the past. Below this graph, you can see the application usage of all the apps being tracked. Below that (not shown) is a listing of each individual application with a link to its 360 dashboards.
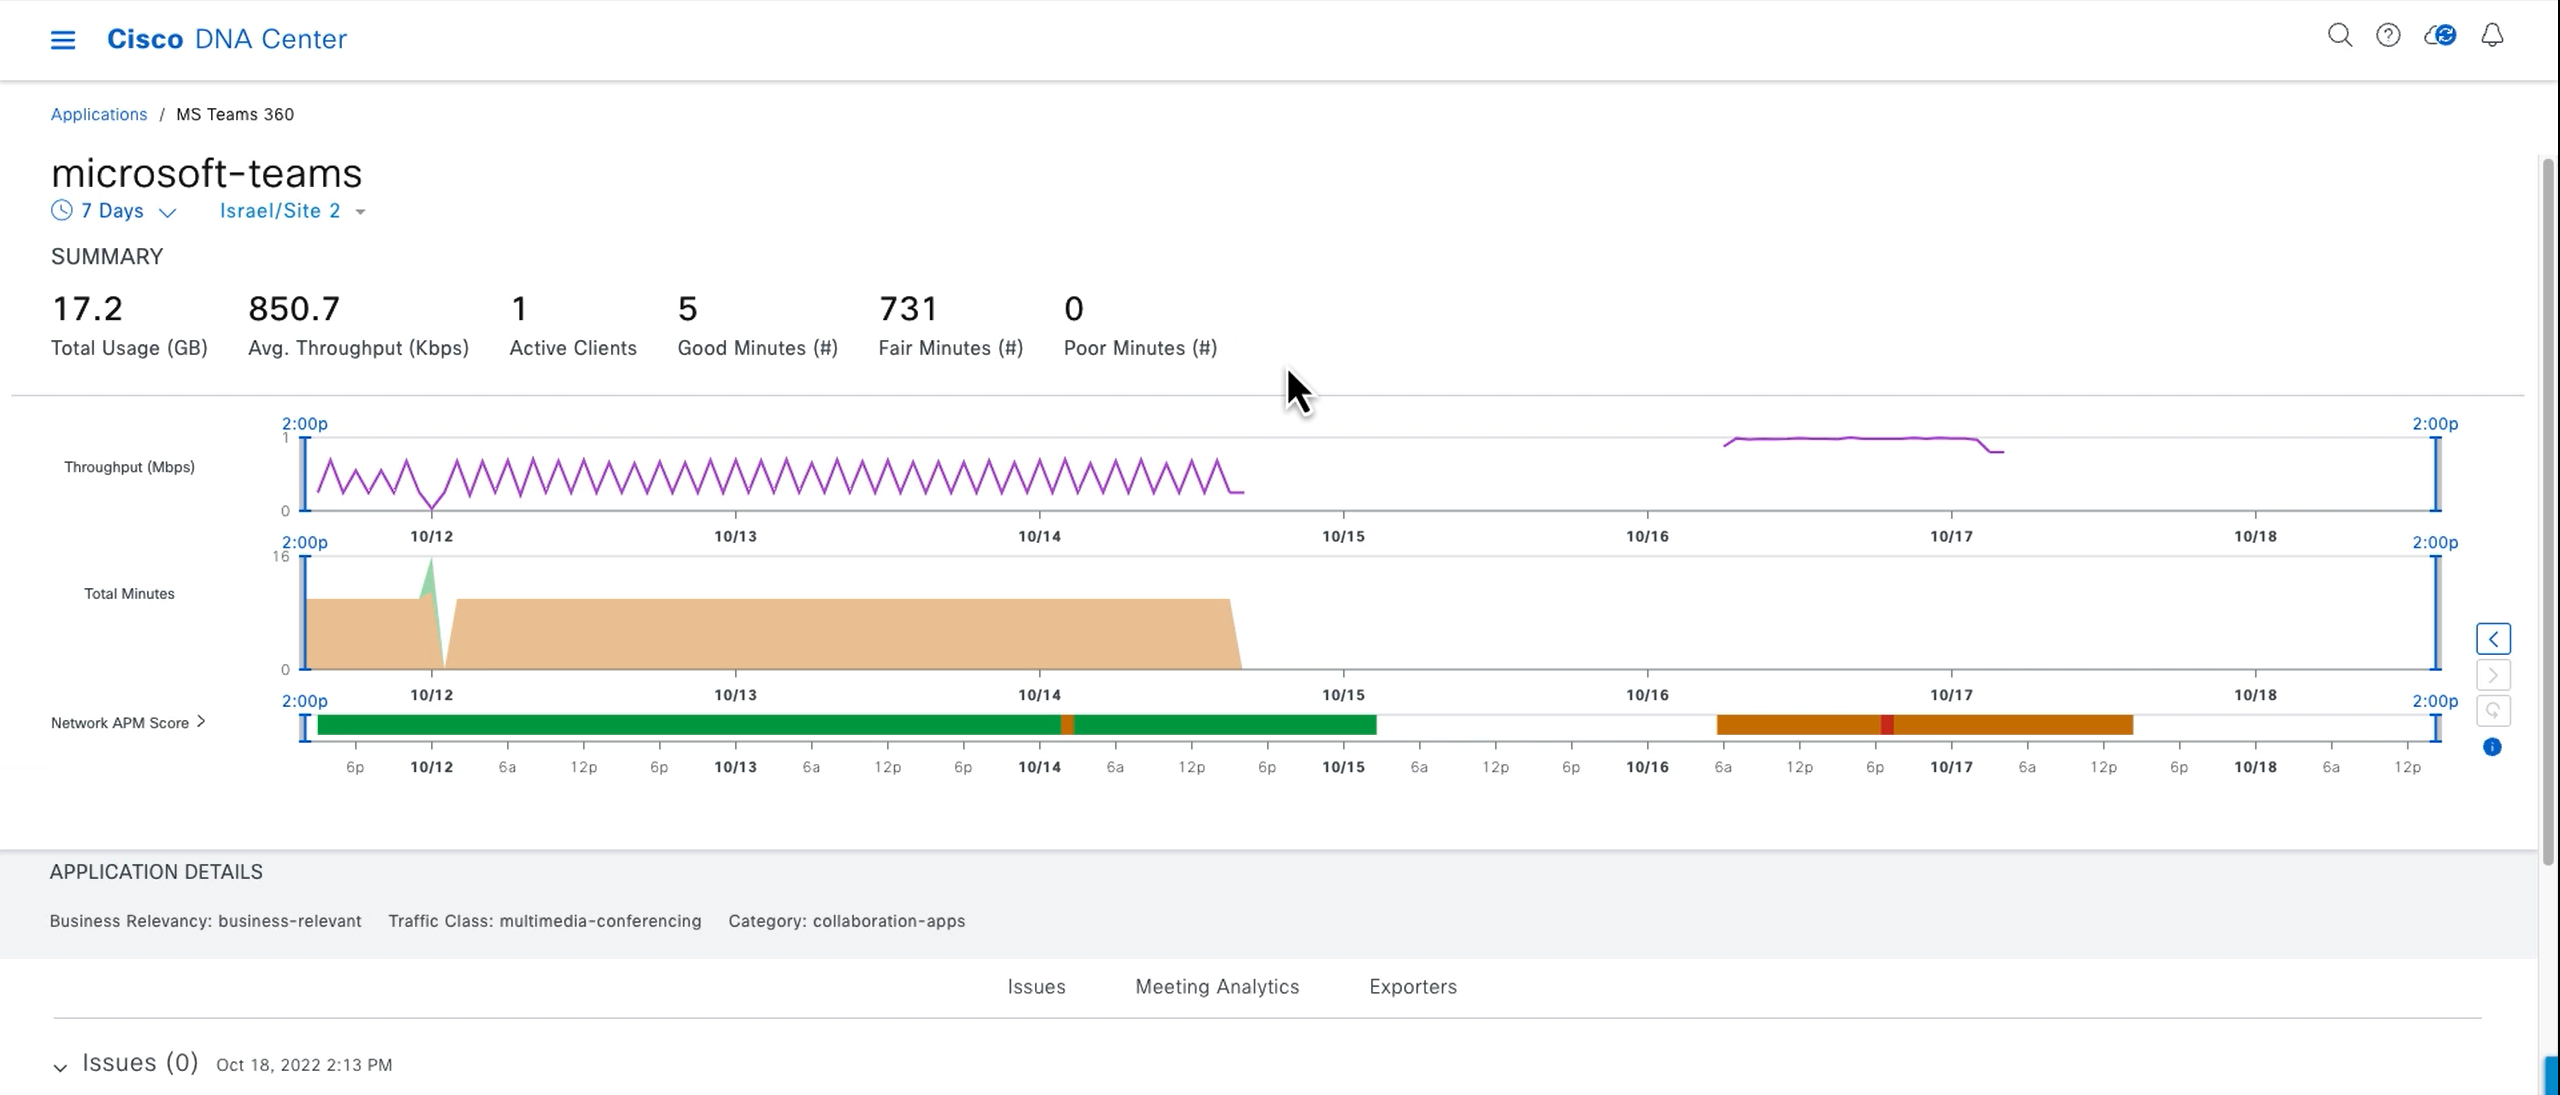
The Microsoft Teams 360 dashboard (shown above) shows the application usage in data, minutes, and clients, as well as overall health. At the bottom of the screen are any issues (none shown) in MS Teams performance. Any deviation in performance will result in an alert in the issues section here and on the main DNA Center Assurance dashboard. Customers using ITSM or incident tracking software, such as ServiceNow or PagerDuty, can use Cisco’s turn-key API templates to export these notifications to that platform and receive alerts there as well.
Troubleshooting a Webex performance alert
Cisco DNA Center is using three key sections of the analytics platform to detect application issues, instantly locate and source, find the root cause, and remediate the issue.
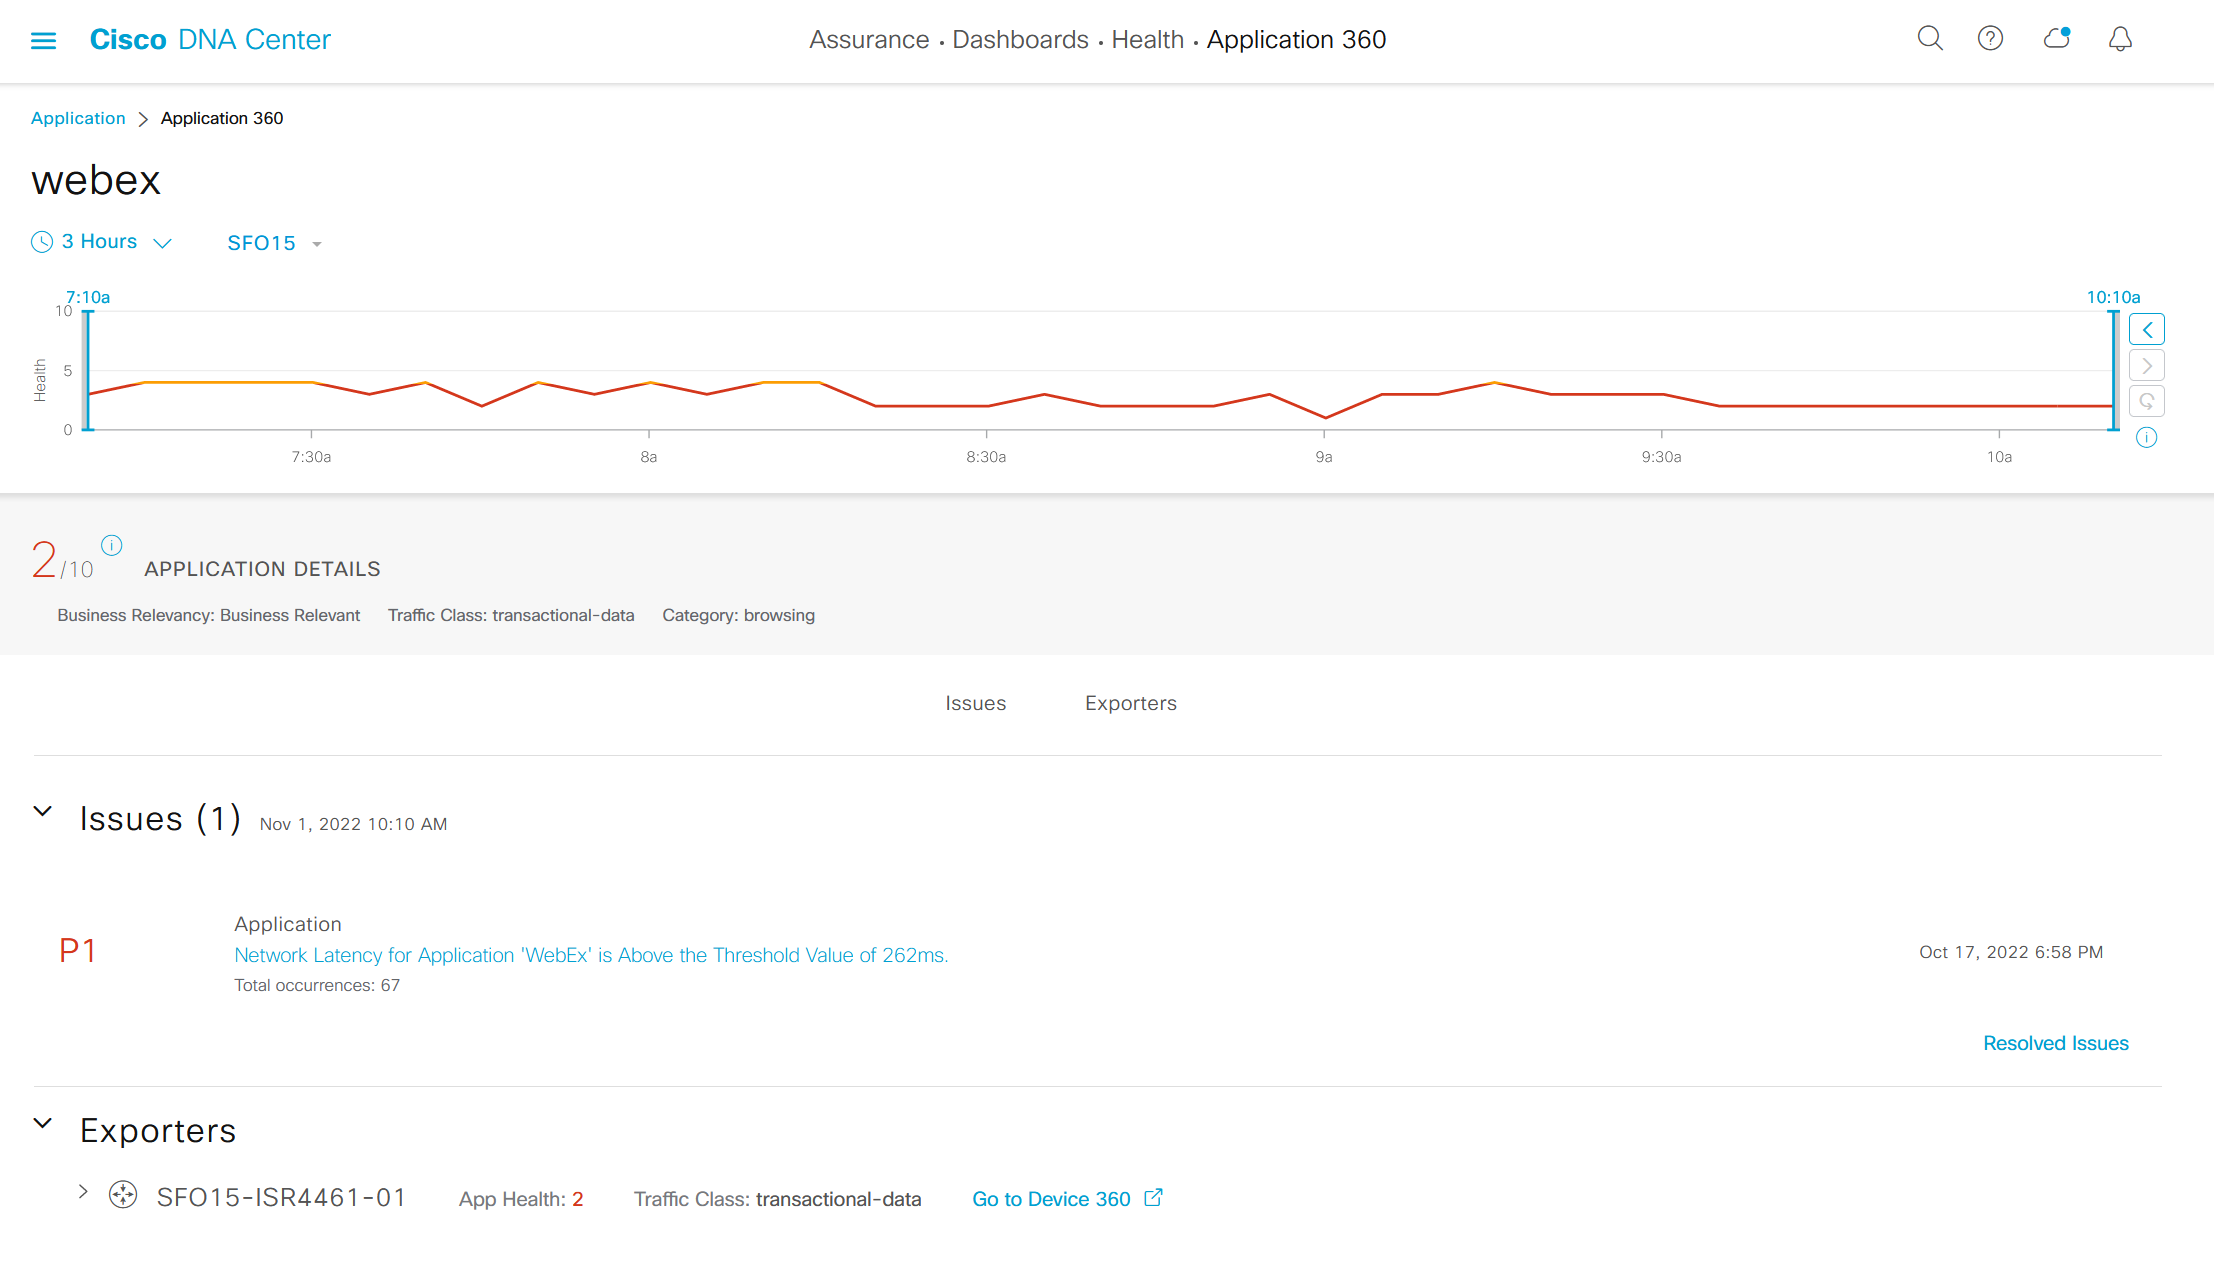
- The Webex 360 dashboard in Figure 3 above is showing a Webex alert for high latency. I can click on the alert link to resolve, but let’s scroll down on the page and see what triggered this.

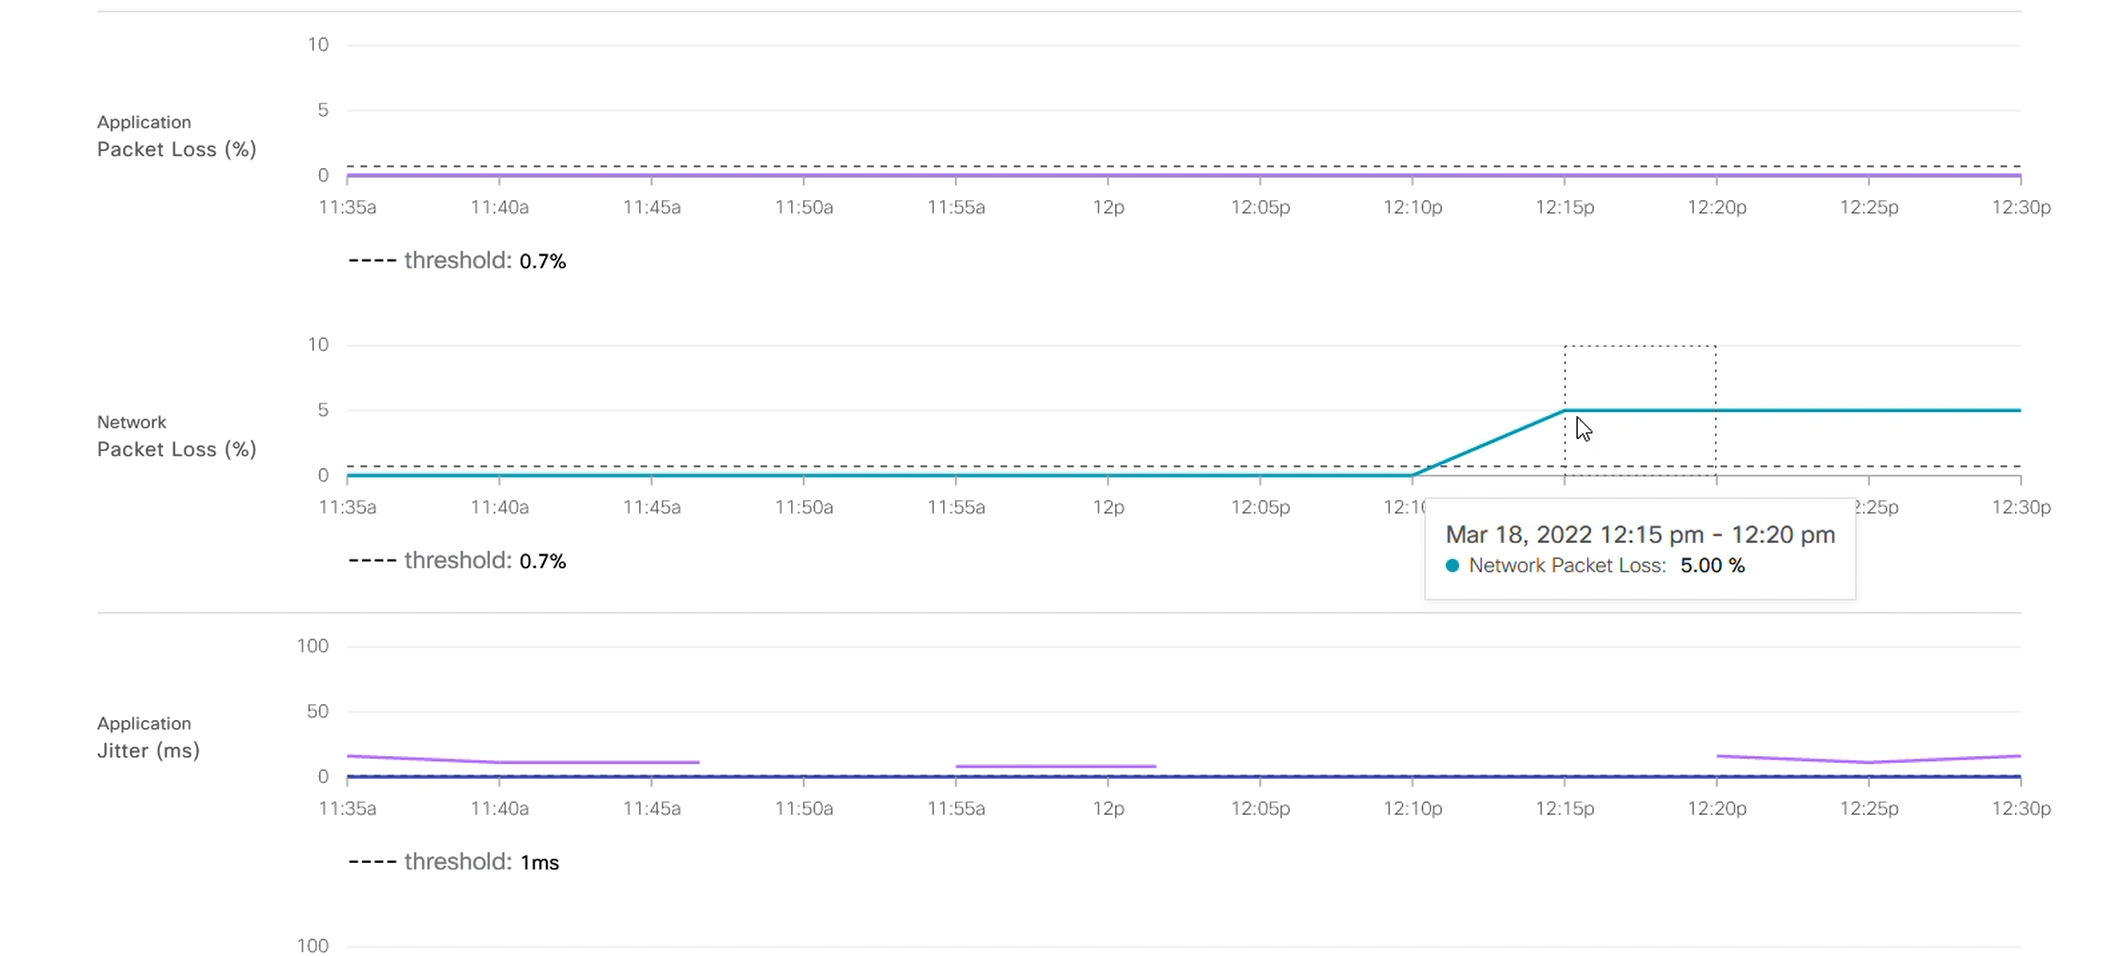
Figure 4: The packet loss that caused this Webex alert. - The figure above is a screenshot taken further down on the same Webex 360 dashboard. It shows the call metrics like audio quality, video quality, and share quality, as well as data metrics like packet loss, jitter, media bit rate, etc. In Figure 4 below, I can see that I have packet loss in the network (the blue line). The packet loss is not that big, in fact only 5%, but it is enough to have caused a small quality problem in this Webex call. The line above, in purple, shows the application packet loss, which is zero. This tells me that my quality problem is in the local network. If the packet loss was in the application, this would indicate that the problem is outside of the campus network, and I would use Cisco ThousandEyes to locate the issue. I’ll show you how this works further down.
- Since I know the problem is on my local campus, let’s click directly on the issue link to see where the problem is and how to resolve it. In Figure 5 below you can see the remediation page for this particular issue: “Network Latency for Application ‘WebEx’ is Above the Threshold Value of 262ms.” Notice the “AI” in a box next to the issue name. This indicates that the problem was diagnosed in the DNA Center AI-Network Analytics cloud. If you are interested in the actual root cause analysis, look at the graph under “Network Causes.” Notice the green area along the graph, which represents the acceptable norm for throughput during this time of day in this area of my network. This is the “baseline” which is created by the DNA Center machine learning engine. The blue line represents the actual throughput, and you can see that this blue line has dropped below the green area, which is why the alert was triggered. The alert is highlighted in red. Below this area, we see the suggested actions where we are being advised that additional 5 GHz Wi-Fi coverage is recommended at this location.
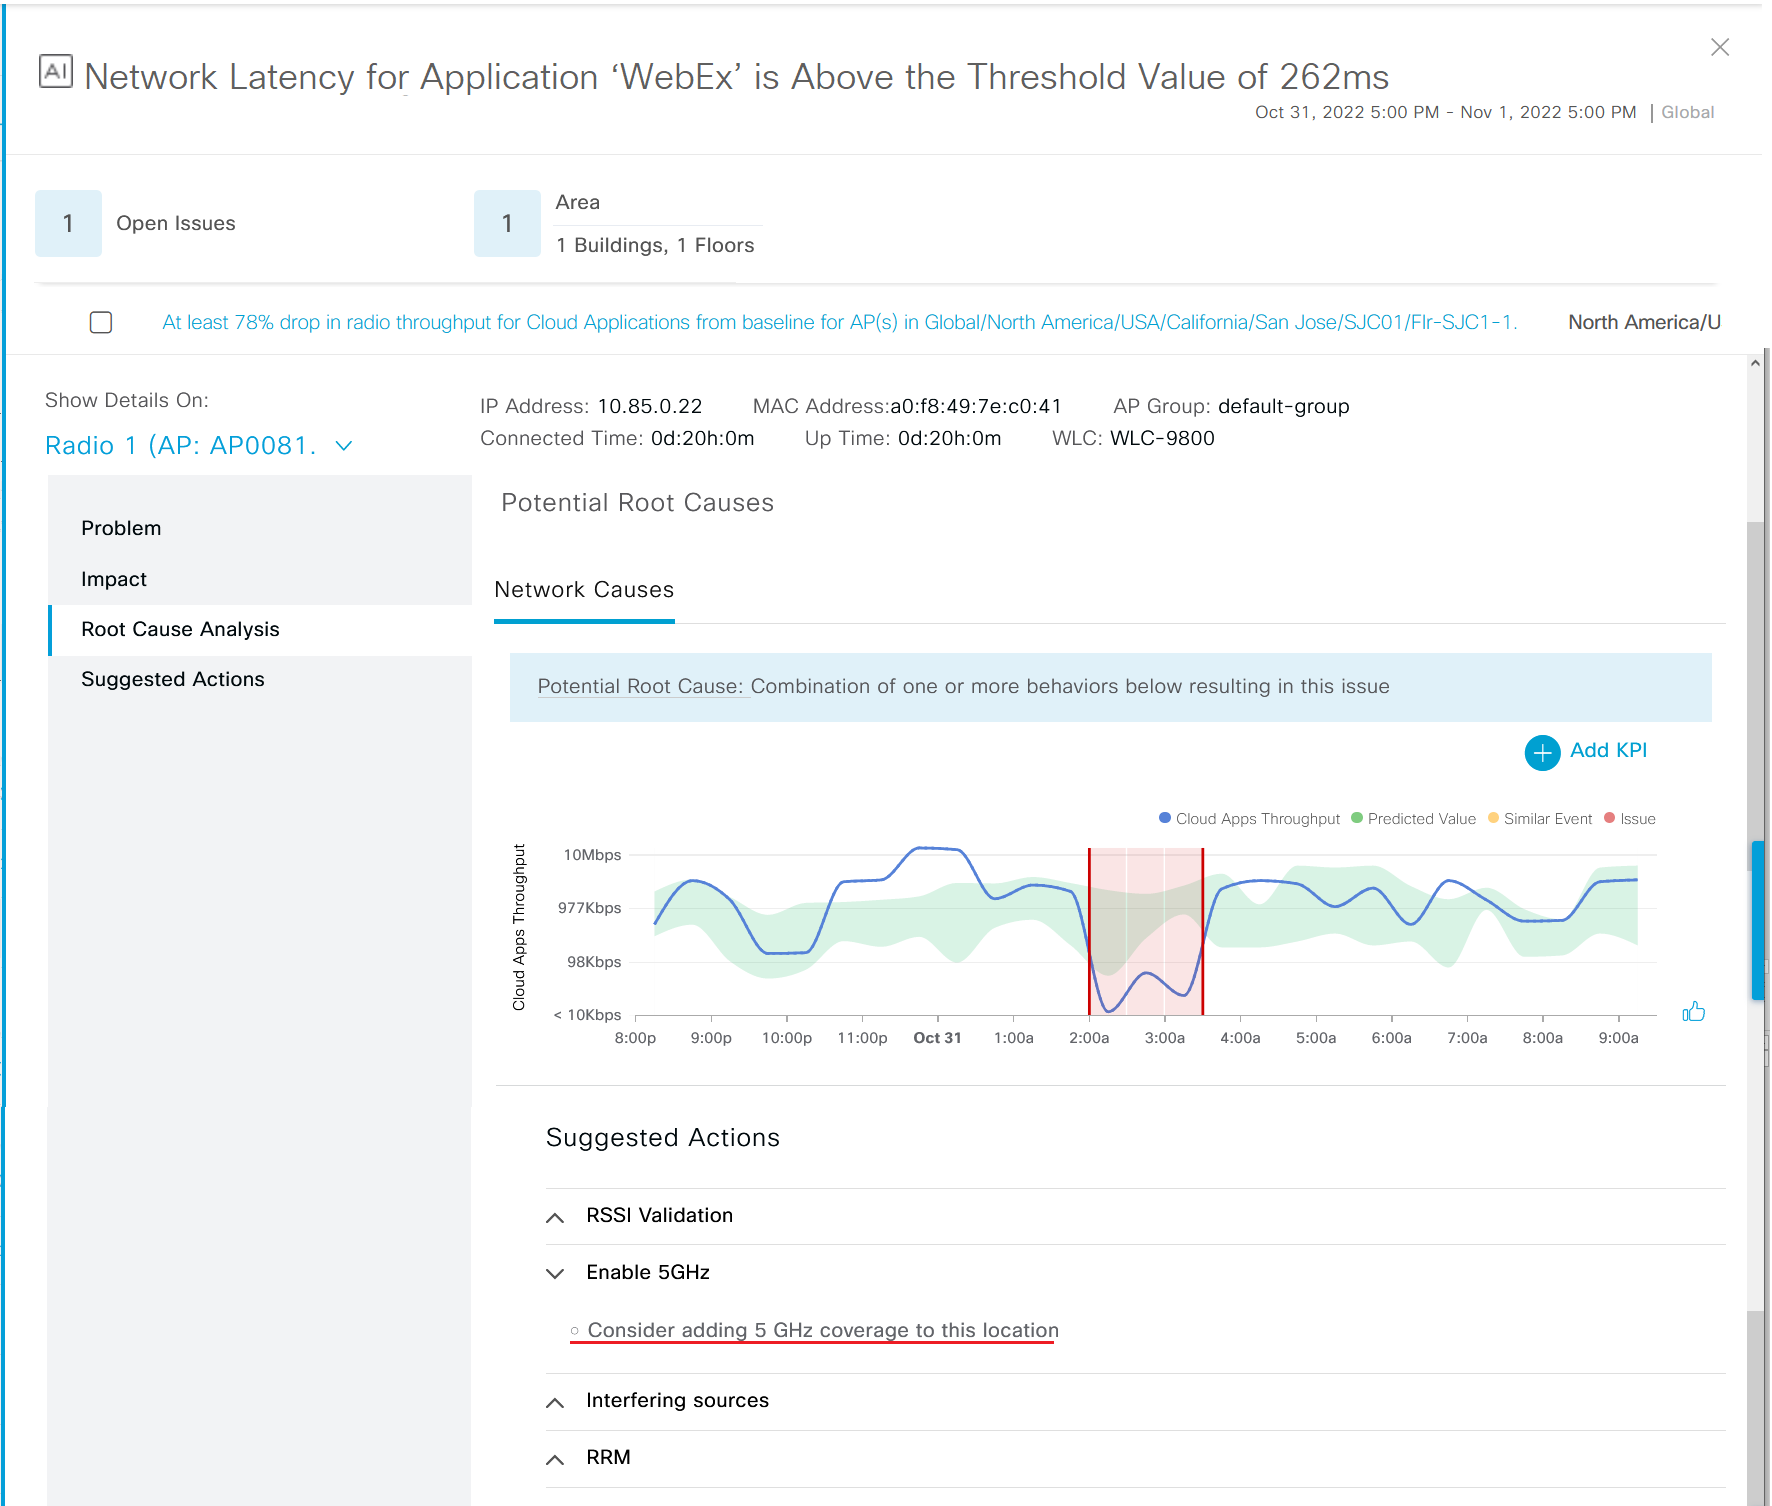
The first thing I’d like to point out is that for the IT individual attending to this issue, the process is much shorter than my explanation makes it seem. Usually, when an alert comes in, the admin will click directly on the alert, and then go immediately to the suggested remediation. It’s fast and simple! The other interesting point is that the smallest packet loss (5%) during a Webex call has triggered an alert that pointed out that we are low on Wi-Fi capacity in this area. This is proactive management at its best. I can now look at the best way to increase capacity in this area without an emergency hanging over my head.
Troubleshooting Application issues outside of the campus with ThousandEyes
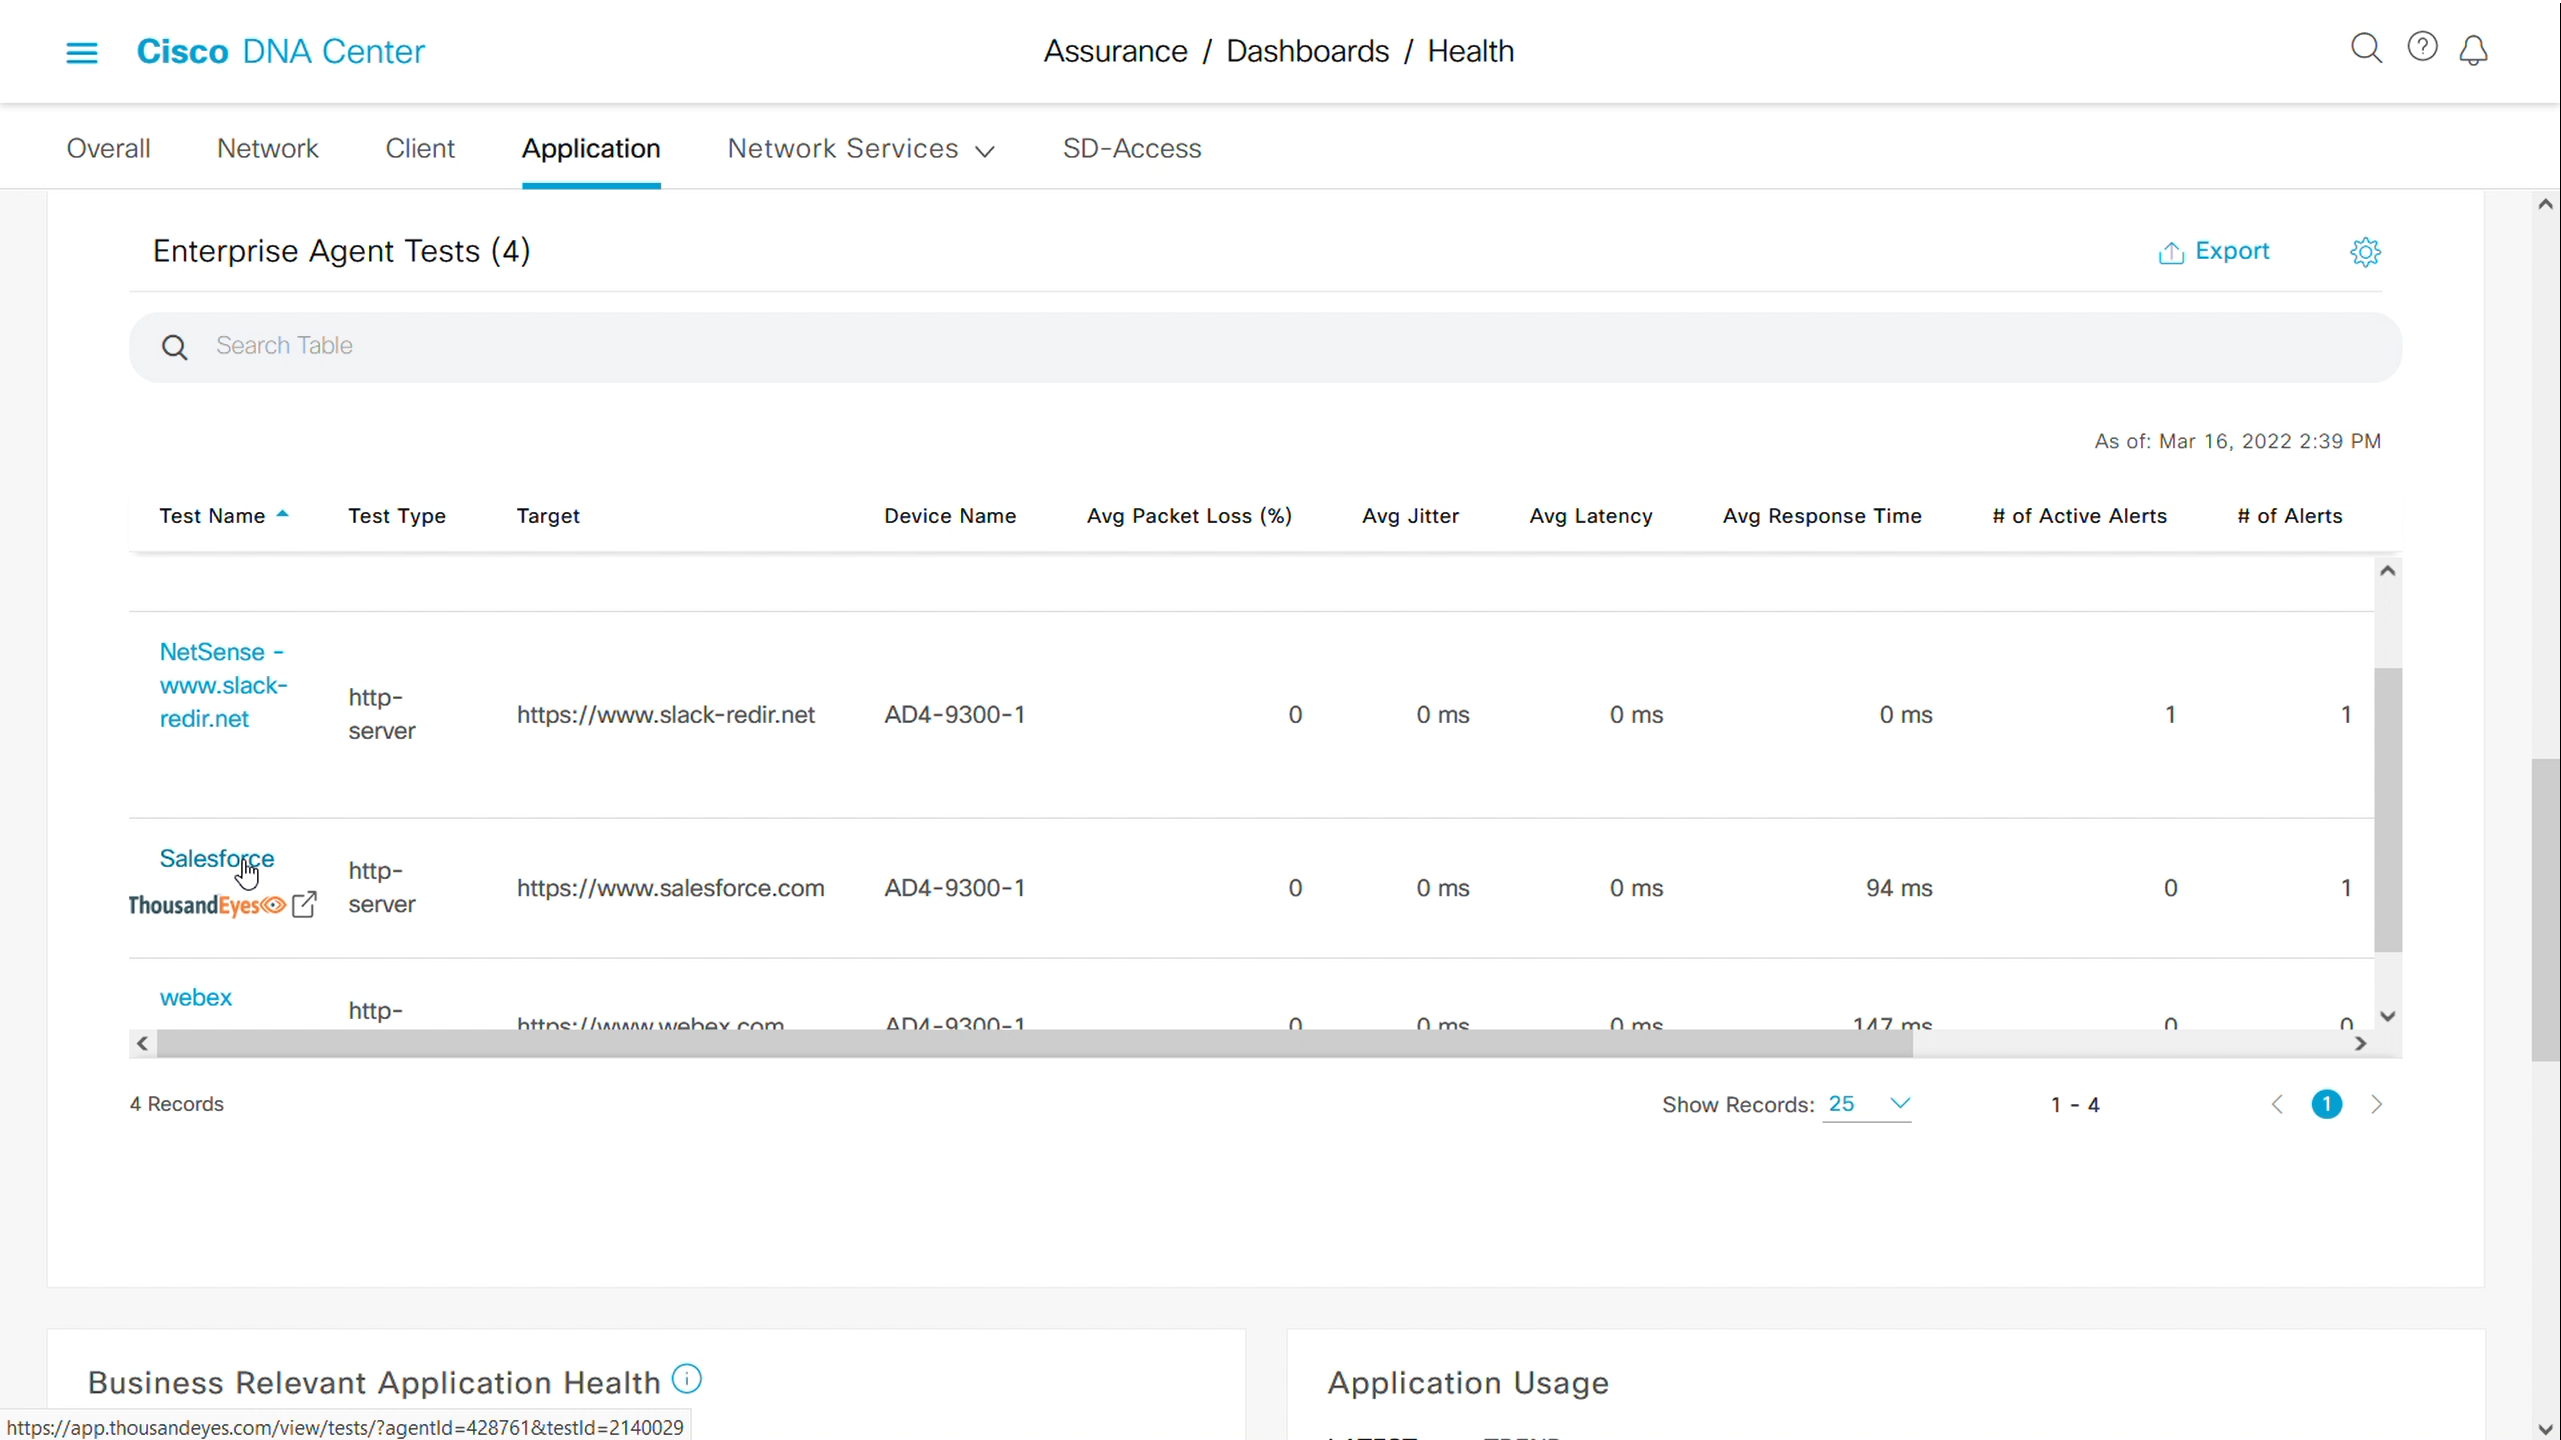
In point 1 above I mentioned that if this problem were outside of my local network, I could launch ThousandEyes to troubleshoot the issue. Let’s take a look at what that looks like. In Figure 6 below you can see my application health dashboard, and right above my Webex alert, there is a Salesforce listing. Notice the ThousandEyes logo right below the word Salesforce. This is a link that will launch the ThousandEyes dashboard, right from within DNA Center, so that I can troubleshoot the Salesforce issue in the WAN, data center, and cloud. And in case you didn’t know, ThousandEyes is included with your Cisco DNA Advantage license. So, if you are using application experience, you will always have ThousandEyes available for issues outside of the local network. For more information on ThousandEyes in Cisco DNA Center check out the blog “Better Together: Cisco DNA Center and ThousandEyes.”
When collaboration apps provide a flawless communication experience for everyone, location is no longer a barrier to team productivity. Businesses know this and have made large investments in collaboration software for their hybrid workforce. But even an excellent software product cannot deliver quality audio and video when the IP network it runs on is faulty. Now those application servers are located in the cloud and workers log in from anywhere, providing the optimal collaboration experience has become a herculean undertaking. Let Cisco DNA Center do the heaving lifting and allow you to keep on top of your collaboration experience and proactively optimize your network in the process.
Get all the technical details on Application Experience at Cisco DNA Center
The Application Assurance Technical Design Guide
Additional Resources:
Join us for a live demo of Cisco DNA Center: The Cisco DNA Center weekly overview Demo


Awesome Blog, Duval!