Wireless connections are ubiquitous and have become a part of our daily lives no differently than electricity. Planning, maintaining, and troubleshooting WiFi networks, optimized for today’s radio coverage and capacity requirements, may not be a simple task for an otherwise seasoned wireless network engineer.
While wireless technologies are ubiquitous, they interact steadily with the physical environment. Architecting the best wireless coverage for a specific environment depends on many different physical factors like obstacles (walls, doors, windows), building geometry, furniture, and materials as well as the user density and intended usage. Different environments encounter a wide range of complexity across different verticals. For example, covering a moderate sized enterprise-office space could be as simple as correctly placing some APs (Access Points) with omni-directional antennas, while covering space with high ceiling such as a warehouse necessitates directional antennas to optimally cover the space and requires more engineering to get it dialed-in right. The challenge is that RF, unless visualized somehow, is invisible. Providing the “super-power” to view the RF in sufficient context to determine the correct angles, power, coverage, and capacity needs requires innovation using specialized and outstanding tools.
Cisco Wireless 3D Analyzer goal is to address challenges like these and enable RF design like never before possible! Cisco customers had access to this innovation starting with Cisco DNA Center release 2.2.3 providing features like the following:
What’s new?
As we continue to drive innovation and lead the market with RF visualization, Cisco DNA Center release 2.3.3 brings new amazing key Wireless 3D Analyzer functionalities. This extends Cisco DNA Center’s tooling set and enables impeccable user experience on the wireless network. Below are a few of the new functionalities:
Multi-floor Management
In scenarios where a network engineer needs to provide WiFi coverage in a high-rise office building, APs will be placed on each floor of the building to have the level of coverage desired (i.e. –65DBm). But one of the crucial issues is that APs on a given floor could create interferences to the adjacent floors below or above. This is why Cisco Wireless 3D Analyzer introduced the multi-floor view to provide the 3D perspective. Using this new functionality, the user can select adjacent floors up to 2 floors above and 2 floors below. Therefore, they can see what the contributions of RF impacts on the current floor are.
In figure 2, we can clearly see the contributions of intra-floor interferences from the floor above and below.
Coverage Area Management
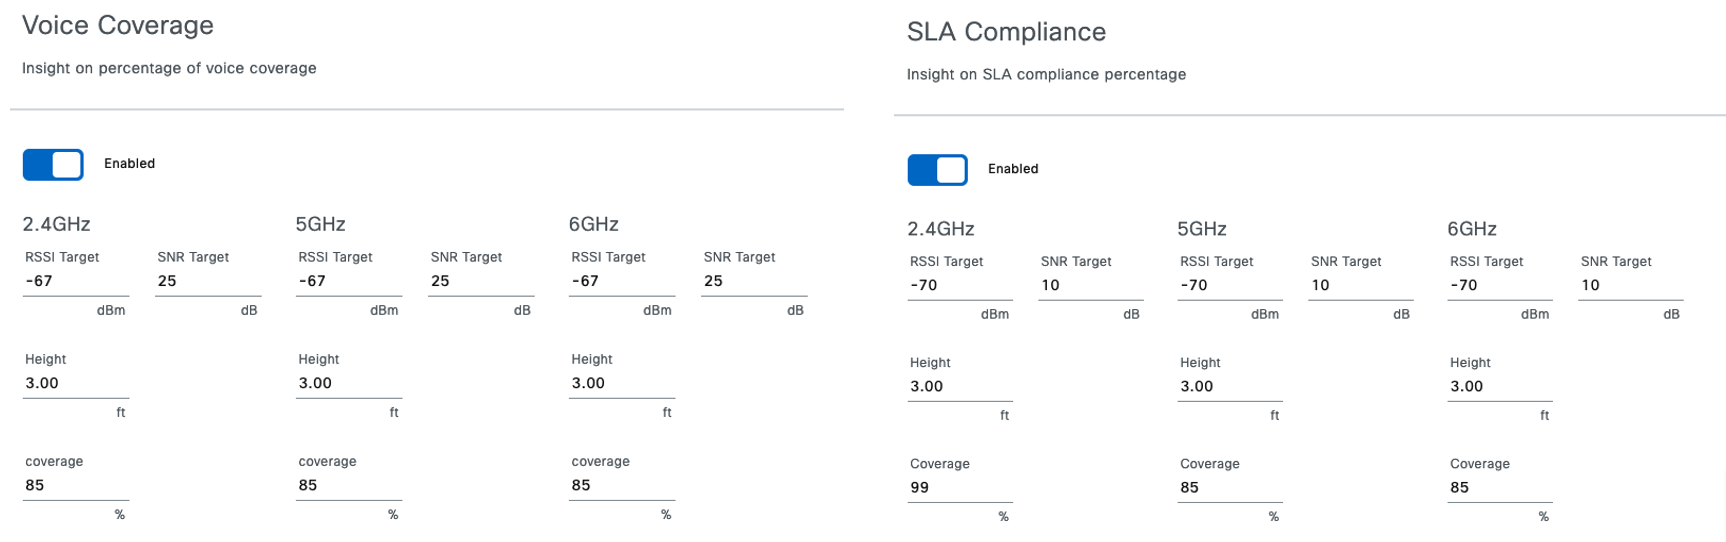
The Cisco Wireless 3D Analyzer Insights View allows an amazing deep dive into possible issues the wireless network can experience, and it can be configured according to key parameters and KPIs as shown in figure 3 below
A common use case is where the network engineer is interested in a specific area of the floor as opposed to the entire floor. Therefore, Cisco Wireless 3D Analyzer added the Coverage Area feature that allows the user to easily define the area of interest for a floor as shown in figure 4.
With this functionality, Wireless 3D Analyzer will compute the insights for that specific area of interest to the network engineer.
3D Client Location
Wireless networks are there to support clients (humans or machines). Wireless 3D Analyzer now supports a Client Location View depicted in figure 5 below.
Taking advantage of the integration with Cisco DNA Spaces, location analytics, and the related triangulations of the client’s positions, Cisco Wireless 3D analyzer can show the client’s location in the 3D space. Moreover, for those clients, Cisco DNA Center can track data around RSSI, SNR, or health scores in the same position. Finally, it collects all the available client data and shows it by clicking on the client on the 3D map.
WiFi 6E Support
Cisco recently shipped the first WiFi 6E APs (see more info at Cisco 6E launch), so Wireless 3D Analyzer supports and integrates the new 6GHz band together with the new WiFi 6E AP models.
In the picture above we can see how the coverage iso-surfaces change using the 6GHz band for the selected AP.
Conclusion
Cisco Wireless 3D Analyzer in Cisco DNA Center release 2.3.3 brings innovative and insightful improvements to manage wireless networks. It significantly reduces the manual operations required to optimize the ever-evolving radio coverage requirements. Moreover, Cisco Wireless 3D Analyzer correlates all the amazing data available and displays it in a fully immersive 3D environment. Therefore, it helps customers to accelerate time to value by bringing automation, immersive NetOps, and AIOps to their wireless network operations.
For more information visit,
Cisco Wireless AIOps
Additional Resources