 This blog is authored by Josh Hendrick, Senior Solutions Engineer at Rookout.
It’s been truly amazing to watch the software development industry grow and evolve over the past 20 years. We’ve gone from building tightly coupled now considered monolithic applications in the standard client-server approach to complex, highly-distributed microservice-based systems which can autoscale up or down on demand. Cloud computing has commoditized compute infrastructure, making it possible for anyone to build applications that can easily scale as demand grows, as well as compete with applications developed by the best companies in the business. It’s definitely an exciting time to be a software developer as the ecosystem continues to grow and the possibilities for the future are endless.
With all of this ever-changing complexity, being able to properly observe and understand what’s happening within your applications as they’re running in their native environments is more important than ever. Due to the complex and highly distributed nature of applications today, there are many places where things can and do go wrong. Many organizations are creating focused teams within the realm of observability in order to put in place best of breed tools, processes, and cultural changes in order to build highly observable software systems.
Observing Running Code
When we stop and take a look at the process of how developers observe what’s happening within the code they’ve written while their applications are running, it really hasn’t changed much over the past 20 years. Sure, there are all sorts of application performance monitoring, tracing, and event management tools, but the way that developers typically inspect the internal state of their running code still relies on writing log lines.
Wouldn’t it be nice if you could easily inspect the state of your running applications including objects, variable values, or any other component within your code while it’s running without having to write more log lines and redeploy your application? That’s exactly one of the challenges Rookout looks to solve. Rookout is a debugging and data-collection solution that allows developers to quickly debug and get data from running applications in any environment (including production) without stopping the application and without impacting its performance.
Why Does it Have to Be That Way?
The founders of Rookout asked themselves a simple question, “Why does it have to be so difficult to debug running applications and to get the data needed to properly get to the bottom of issues?” In many large enterprises, the process for introducing new code changes, even simply adding log lines, can be a lengthy process. A typical enterprise process for development teams may look something like this:

Imagine you find a defect in your codebase and find yourself needing to add more log lines in order to understand what’s happening while your application is running in staging or production environments. Typically you would write more logs, test your code, submit a PR, execute CI/CD processes, and wait for your code to be deployed.
With Rookout running as part of your codebase, you gain the ability to bypass the slowness of the above scenario by directly setting “Non-Breaking Breakpoints” (Rookout doesn’t stop your application) at any place within your code and collecting real-time snapshots of data from within your application regardless of where it’s running. No need to change your code or redeploy your application. Rookout runs as an SDK (or agent in the case of Java) alongside your application and currently supports any JVM based language, Python, Node.js, and .NET. Details for getting started with various languages can be found in the Rookout documentation.
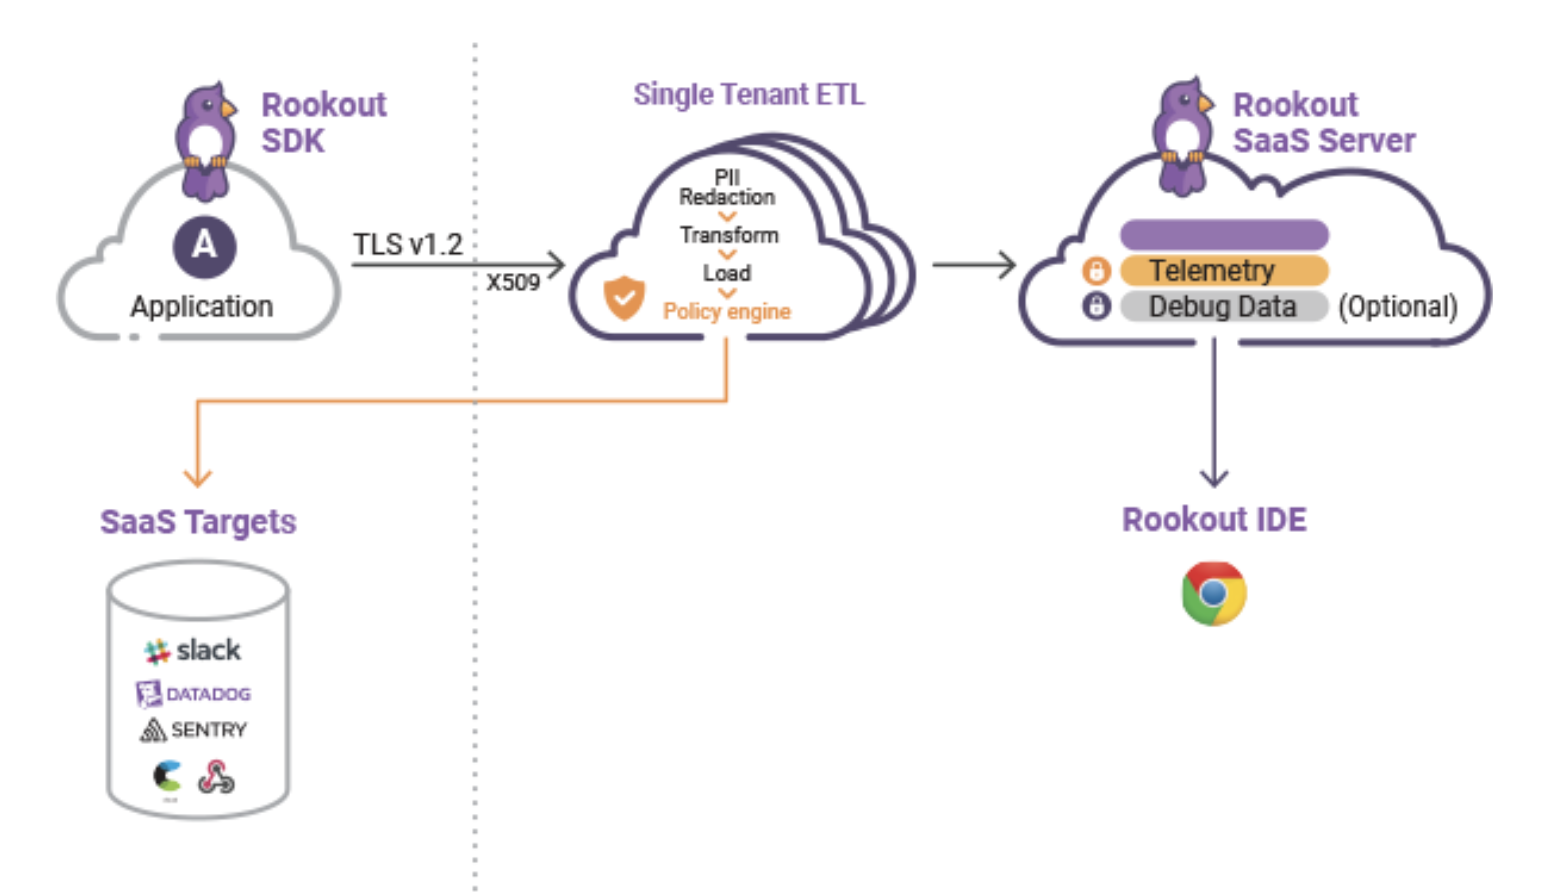
Rookout runs as a SaaS-based application with deployment options available for keeping data on-prem based on your needs. Data collected from Rookout can also be sent to any external logging or monitoring system, or any system that has an API exposed. Here is a sample architecture diagram showing how Rookout works and communicates with various components in your environment.
Rookout aims to help development teams increase the velocity at which they can develop applications by making the debugging process simpler and more efficient. Many organizations now monitor and track the meantime to resolution of defects. With Rookout giving access to data directly within your running application on demand, organizations are able to more quickly understand the root cause of issues.
In addition, it’s a handy tool for developers just starting to get familiar with a new codebase. By collecting snapshot data from Non-Breaking Breakpoints, Rookout will show variable values from your application directly within code. This makes the process of understanding a good code base much more simple for new or veteran developers alike.
Getting Started with Rookout
To get started with Rookout, you can sign up for a free account at www.rookout.com. A good place to start is the Rookout Workshop which has been published on the DevNet Cisco Code Exchange. This workshop guides developers through hands-on content for getting familiar with configuring the Rookout SDK, using the Rookout interface, filtering your application instances to find the data you need, configuring Non-Breaking Breakpoints, and configuring external targets for sending data to.
We love customer feedback – let us know if you get a chance to try Rookout! You can reach out to us at https://www.rookout.com/company/contact or directly within the Rookout App by using our in app chat which connects you directly to our engineers.
We’d love to hear what you think. Ask a question or leave a comment below.
And stay connected with Cisco DevNet on social!
Twitter @CiscoDevNet | Facebook | LinkedIn
Visit the new Developer Video Channel


