
Are you a network engineer who is tinkering with network programmability, but need more help implementing your vision for mass provisioning and/or observability?
Or, maybe you’re a software developer who is interested in using your programming, API, database, and visualization skills in a new way with networking, but need product insight to know what’s impactful?
If either of these are true, you might be interested in some background on how we used DevOps fundamentals in the CiscoLive Network Operations Center (NOC).
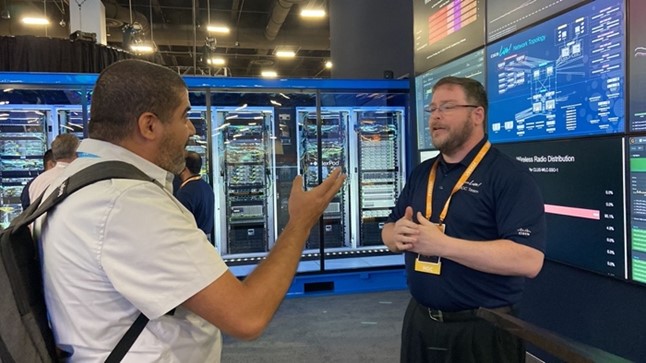
A couple months have passed since CiscoLive 2022 in Las Vegas, so it seems a good time to reflect. I had the privilege to participate again in the Cisco Live NOC – focusing on automation, observability, and network programmability. I’ve served multi-purpose roles of speaker and event-staff/NOC for many years. It’s one of my favorite activities during the year.
Running a secure, non-stop, high-performance network
Preparation for the June Las Vegas event started soon after the New Year. We begin with our base requirements of running a secure, non-stop, high-performance network that showcases product capabilities and benefits. We gather product guidance and new-release intent from the various product teams and map that against well-developed network infrastructure designs we’ve used year-over-year that include modularity, layered security, service resiliency and virtualization.
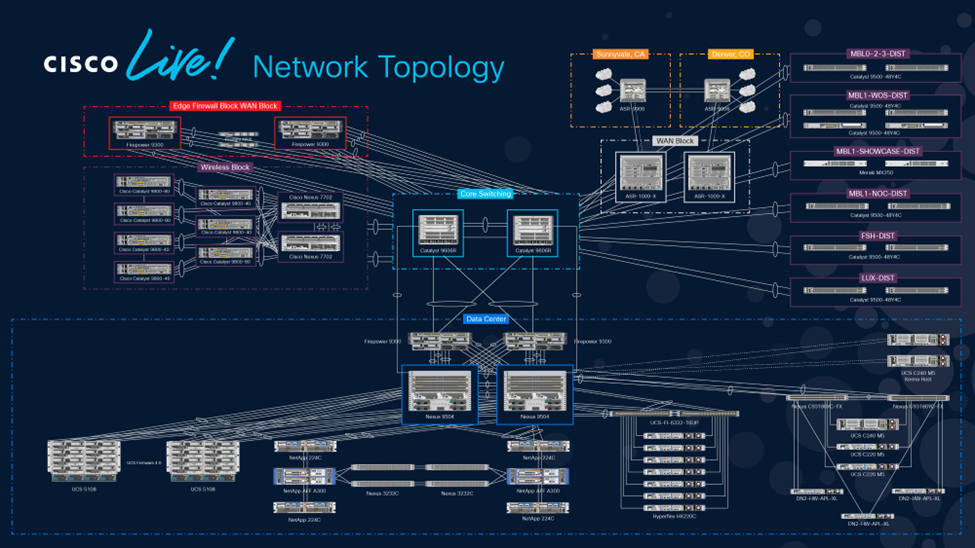 CiscoLive Network Topology
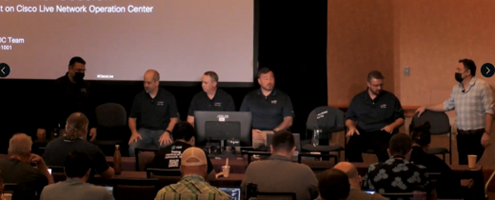
NOC subject matter experts
The last in-person event for the US was CiscoLive 2019 in San Diego. Since then we’ve realized many product changes. For my part, I was interested to exercise new streaming telemetry capabilities that were evolving several years earlier.
The NOC has several subject matter experts across the company in Customer Experience (CX) [includes TAC], Engineering, IT, and Sales. I am coming from the Engineering side in our Developer Relations team (DevNet). While conversant in most of our networking technologies, I specialize in the programmability, APIs, databases, dashboarding, virtualization and cloud-native technologies needed to glue our commercial products together with open-source solutions.
 To get the network monitoring aspects solidified we rely on a traditional DevOps model where a developer – me – pairs up with subject matter experts in each of the various IT domains. I met with domain experts like Jason F on routing, Mike on security, Chris on wireless, Richard on switching and others to ensure proper operational coverage.
Familiar tools FOR IT Service Management
We obviously use our commercial products like Cisco DNA Center, Cisco Prime Network Registrar, Cisco Identity Services Engine (ISE), Intersight, the Wireless LAN Controller, Meraki Dashboard, Crosswork, ThousandEyes, and the various SecureX solutions. We complement those with other familiar tools of an IT Service Management environment, like VMware vCenter, NetApp ONTAP, Veeam, and specialized tools like WaitTime. We continued our event design by identifying the configuration management and provisioning functions we want and consider the performance, fault, and telemetry metrics we hope to achieve. The functionality each tool provides is mapped against those intents and gaps are identified. At this point we consider workaround options. Is supplemental information available directly through APIs? Can we develop a proximate analog by combining data from multiple sources? Do we have to drop back to legacy methods with SNMP and/or CLI scraping?
When we have a solid understanding of the requirements, products to be used, the management tool capabilities and the gaps, we often use open-source solutions to fill in the needs. Since the domain experts are usually focused on their domain-specific management tools, the open-source products, programming, and API orchestration activities among all the tools are where I focus my energies.
More streaming telemetry
As I mentioned, I wanted to use more streaming telemetry at this year’s Cisco Live event. We did. Not only did we use gRPC dial-out with some dial-in, but also NETCONF RPC polling for efficiency in some cases. SNMP was not used by ANY of our tailored collectors – only with some of the commercial applications. As the programmability SME, I intended to use YANG models with gRPC streaming telemetry or NETCONF RPC, where available. I spent time reviewing Cisco’s YANG Model Repository and used YANG Suite to test the models against a staging environment.
For example, the ‘Internet Traffic Volume Dashboard’ showed how many terabytes of traffic we exchanged with the Internet.
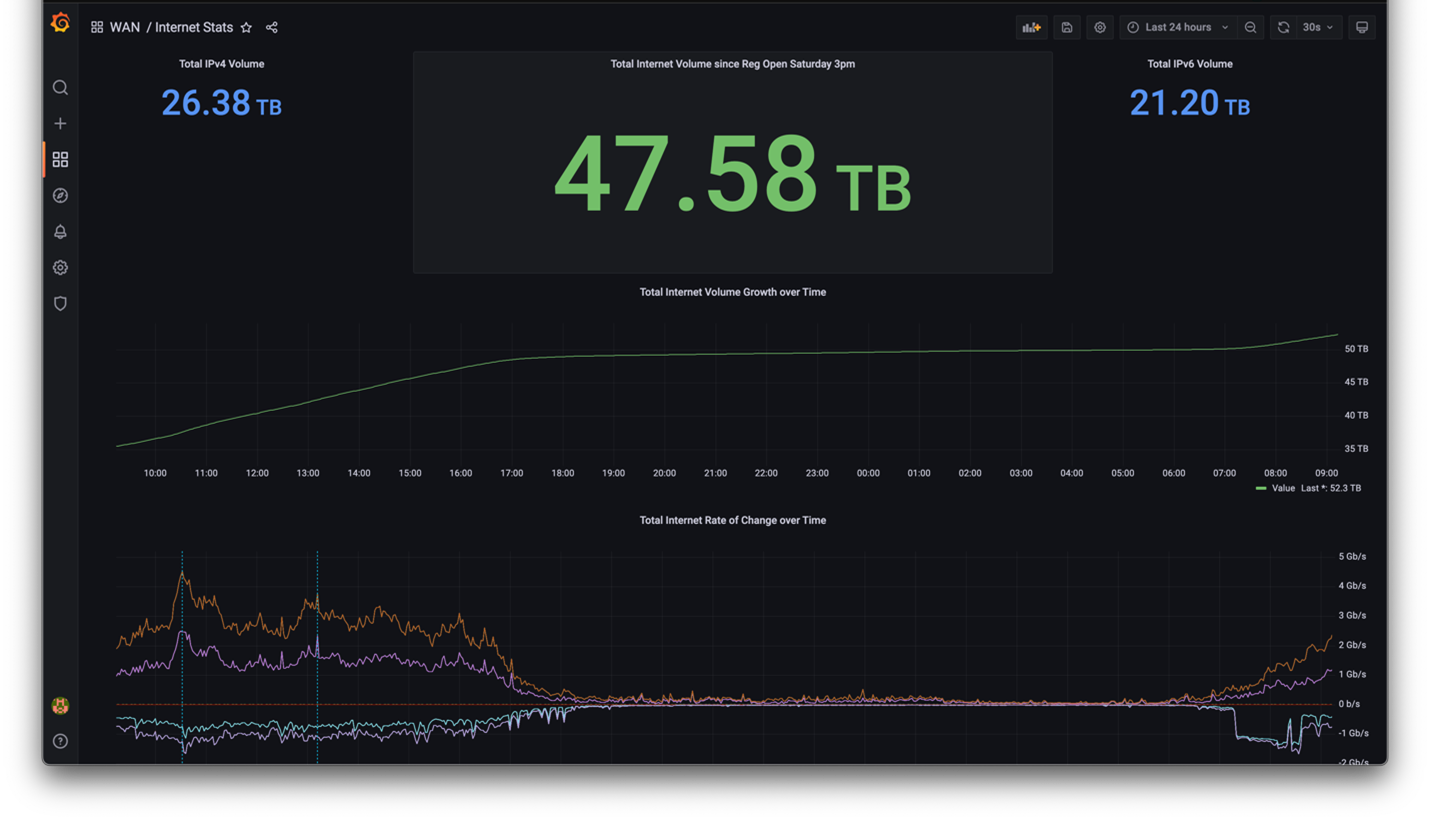 CiscoLive Internet Traffic Volume Dashboard
We liken it to the ‘Tote Board’ that celebrity Jerry Lewis used to show how many millions of dollars were raised for the Muscular Dystrophy Association charity during the Labor Day telethons from 1966 to 2014.
Creating our dashboard
Our dashboard was created by extracting stats from the edge ASR1009-X routers providing our 100 Gbps links to the Internet. A custom NETCONF RPC payload, like the following, was requested every 10 seconds.
<filter xmlns="urn:ietf:params:xml:ns:netconf:base:1.0">
    <interfaces xmlns="http://cisco.com/ns/yang/Cisco-IOS-XE-interfaces-oper">
      <interface>
      <name/>
      <interface-type/>
      <admin-status/>
      <oper-status/>
      <last-change/>
      <speed/>
      <v4-protocol-stats>
        <in-pkts/>
        <in-octets/>
        <out-pkts/>
        <out-octets/>
      </v4-protocol-stats>
      <v6-protocol-stats>
        <in-pkts/>
        <in-octets/>
        <out-pkts/>
        <out-octets/>
      </v6-protocol-stats>
    </interface
  </interfaces>
</filter>
Example – NETCONF RPC payload to obtain efficient interface stats
Once received, the information was parsed into an InfluxDB time-series database, then Grafana was used to query InfluxDB and produce the dashboard visualization as above. Using this method allowed us to be more granular about the specific stats we wanted and reduced the need for filtering at the collector. We look forward to enhanced capabilities in defining specifically filtered sensor-paths for gRPC dial-in/-out for future deployments.
Continuing the DevOps theme of collaboration, our WAN SME was keen to get optical transceiver power levels on the 100 Gig and 10 Gig Internet links. We discussed how If the transmit or receive power levels dropped below optimal thresholds, then performance would suffer, or worse – the link would have a fault.
Unfortunately, the instrumentation was not offered at the individual lane [optical lambda] level we wanted, so we had a gap. Researching work-arounds resulted in a fallback to CLI-scraping of ‘show transceiver’ commands. While this was suboptimal, I was able to come up with a programmatic method to poll the unstructured data and inject it into InfluxDB using Python. The Python schedule library was used to automate this process every 2 minutes. Grafana dashboard templates were created to render data queries to our preferred visualization. The results were beneficial as we could see each lane of all optical transceivers and their transmit and receive power levels.
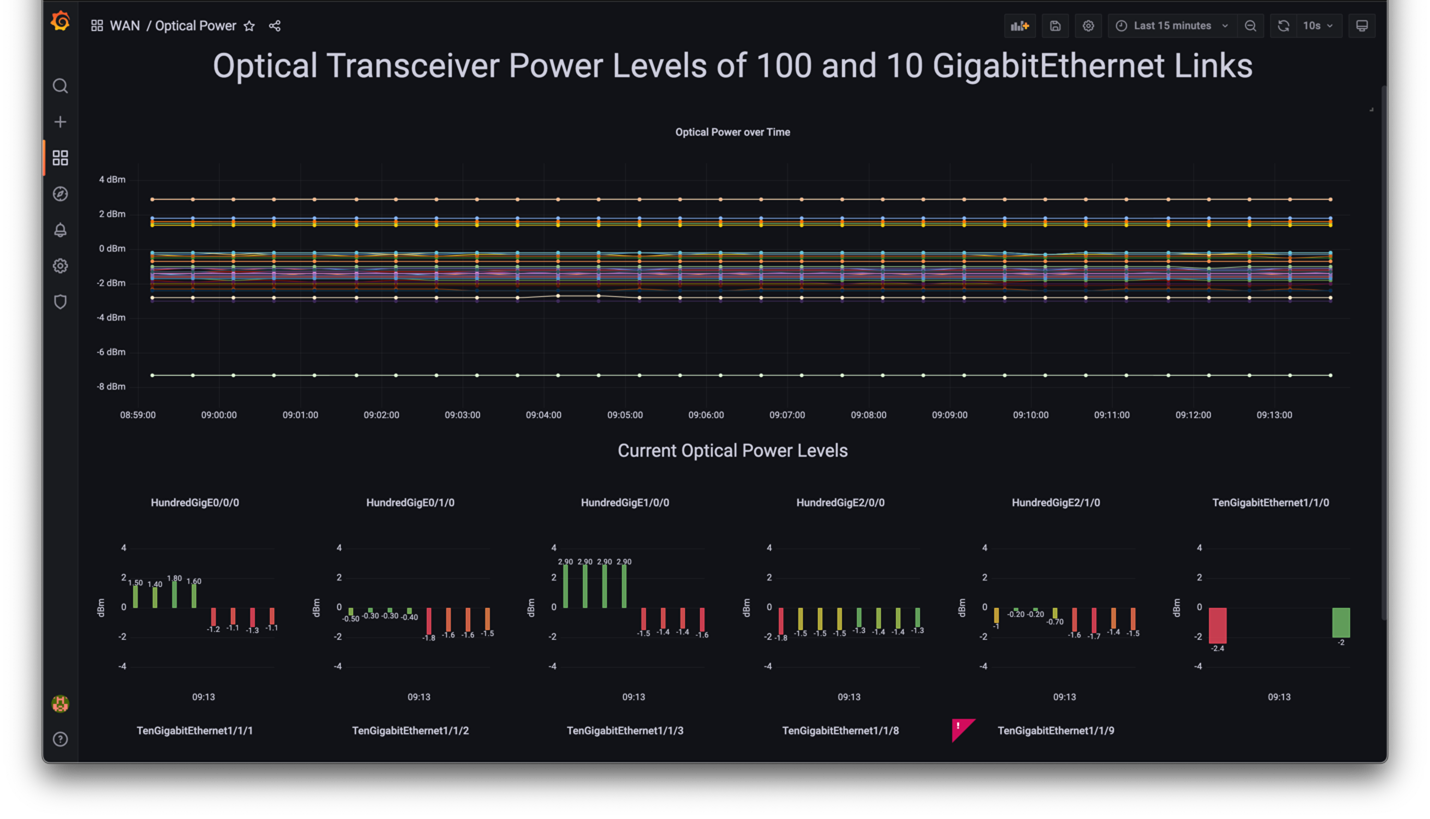 Grafana dashboard of Optical Transceiver Power Levels
Aligning with DevOps
Another DevOps-aligned situation was managing observability with multiple wireless environments. The main conference network, adjacent hotels and keynote area were managed by different clusters of Cisco Wireless LAN Controllers (WLCs). The Four Seasons hotel had Meraki Wi-Fi 6-enabled access points managed via Meraki cloud. After consulting with the wireless SMEs to get their deep insights, experience, and intent, I reviewed the current state of the management tools and portals. To fill in gaps and extend current capabilities, I researched the instrumentation and telemetry available in the WLC and Meraki Dashboard. There was a mixture of NETCONF and REST API methods to consider and we relied on Python scripting to gather data from different sources, normalize them and inject into InfluxDB for Grafana to visualize. The results clarified utilization and resource distribution.
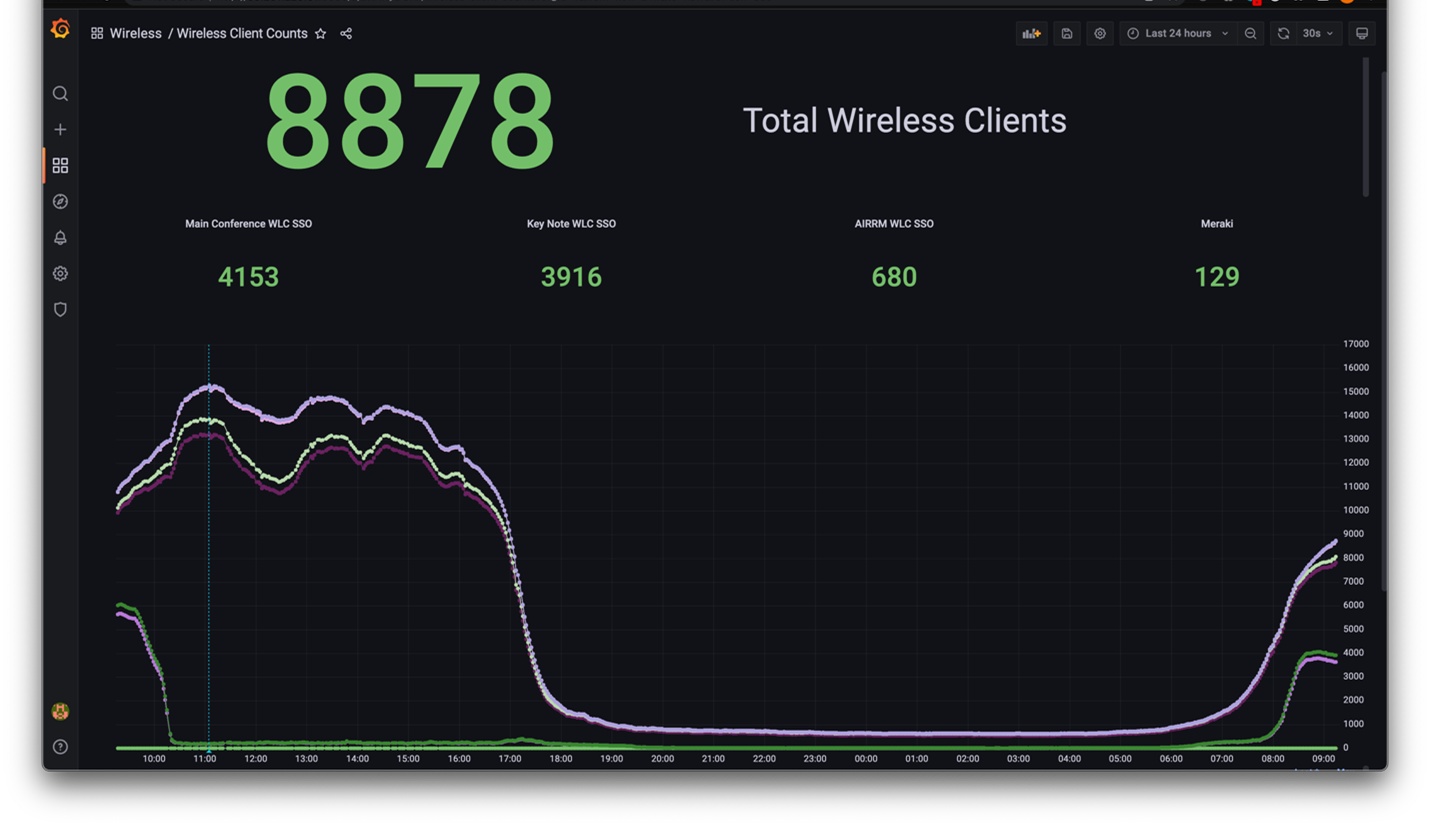 Converged WLC-Meraki Wireless Client Dashboard
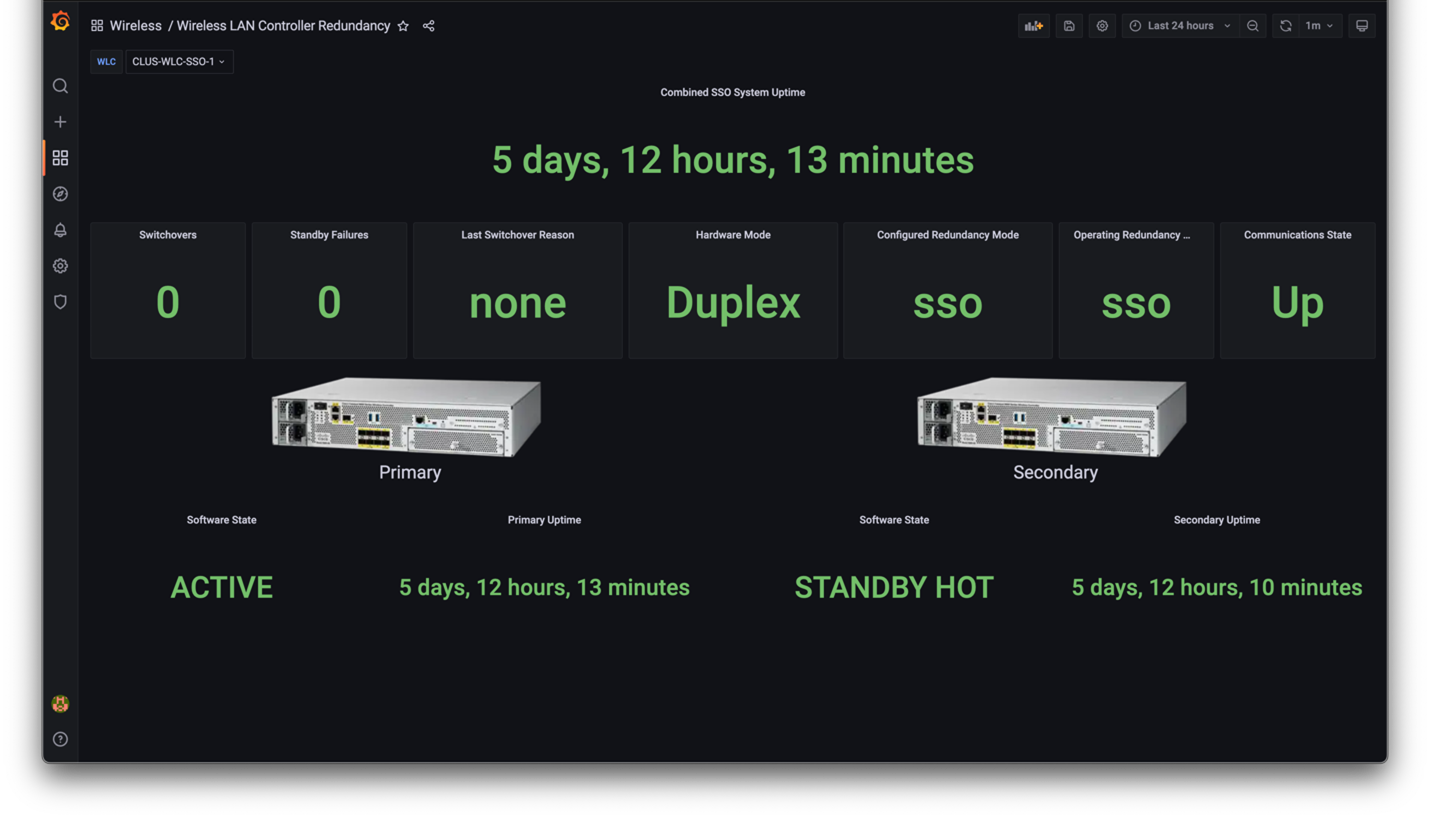 Converged WLC SSO Pair Health Status Dashboard
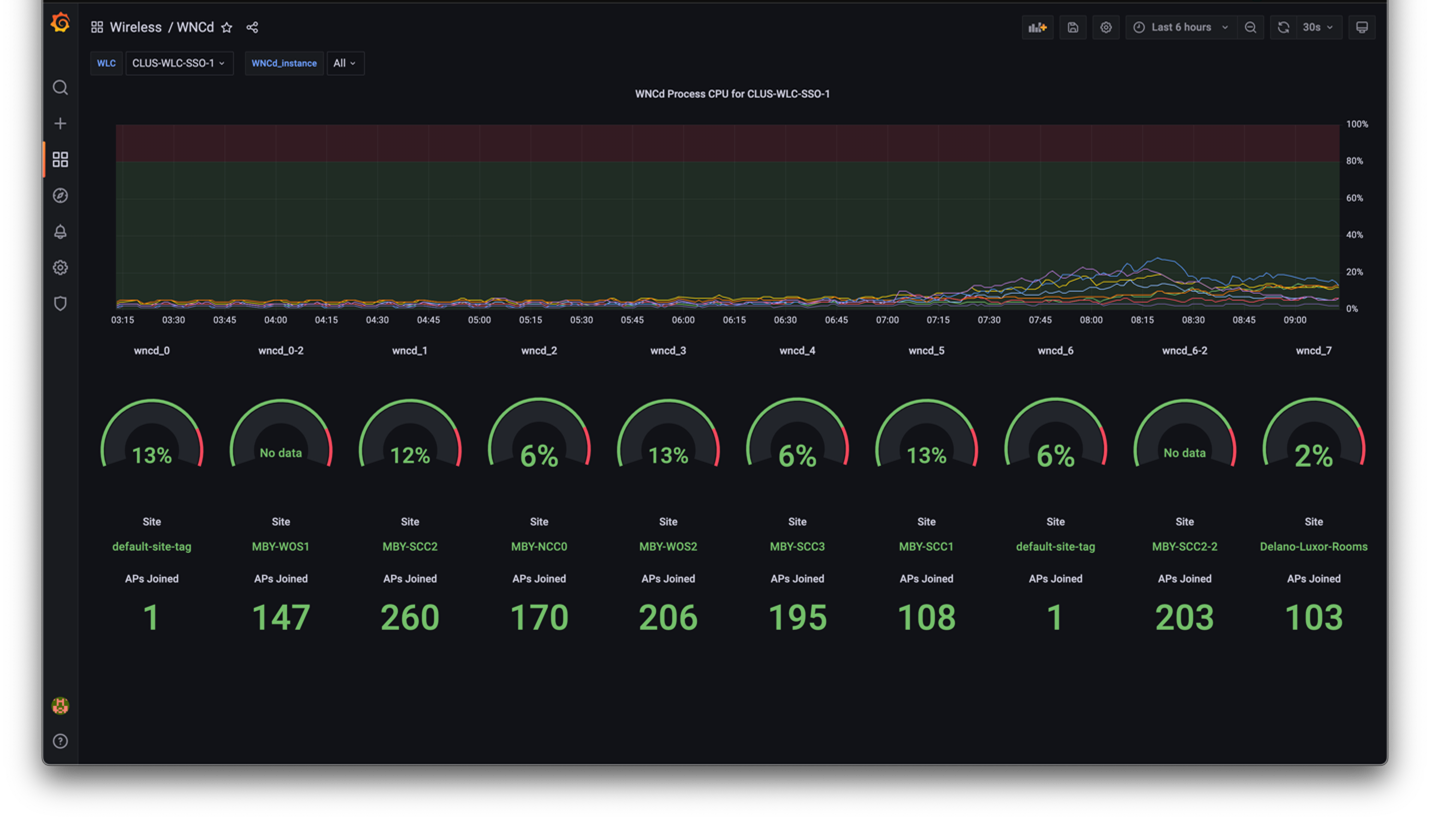 Expert Mode WLC Wireless Network Controller Daemon (WNCd) Health Monitor
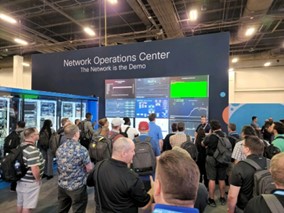
Putting all the tools and collection scripts together provides us several observability dashboards; some we show at the video display wall where you can see what we do!
Many other examples of DevOps collaboration and tailored observability could be shared, but this blog would scroll much, much longer! If you’re interested in some of the Python scripts and Grafana dashboards developed for the event, check out this Github repo – you might be able to repurpose some of the effort for your specific needs!
 Hopefully this blog inspired you to collaborate in a DevOps fashion; if you’re a network engineer – seek out a developer to help in making your vision a reality; if you’re a developer – seek out a network engineer to get more insights on how the products work and what instrumentation and metrics are most meaningful.
For more information of NETCONF, gRPC, telemetry, check these learning resources out:
- Model-Based Management Introduction
- Cisco IOS XE Model-Driven Telemetry (with Sandbox)
- Streaming Telemetry for NX-OS
- Devnet Telemetry searches
Follow me on Twitter for the next event – I’d be happy to talk to you!
We’d love to hear what you think. Ask a question or leave a comment below.
And stay connected with Cisco DevNet on social!
LinkedIn | Twitter @CiscoDevNet | Facebook | YouTube Channel


