
Hank Preston recently wrote a great blog post on using NetBox as a Single Source of Truth to drive Cisco NSO. The approaches described in this post are part of a larger project that he and I are working on to reshape the data center infrastructure that powers the labs found in many Cisco learning courses. We’re doing it with an automation-first, Infrastructure as Code (IaC) approach.
While working on some of the tasks in this larger project (such as automating DNS from NetBox), I quickly discovered a shortcoming in the way I was building my Python scripts. I was printing all the messages directly to the terminal. That’s great when a user manually runs the script, but causes a loss of visibility when run fully automated. How do we know when the scripts run? What the scripts do? And when the scripts hit errors?
As network engineers, we’re very used to doing something like this on all our network devices:
logging host 10.10.10.10
But as NetDevOps engineers, we may forget that logging is equally as important in the automation we build.
Logging In Python
Fortunately, Python has a pretty flexible logging system. I started to drop the following into each of my projects:
[loggers]

keys=root

[handlers]
keys=console,syslog

[formatters]
keys=automation_scripts

[logger_root]
level=DEBUG
handlers=console,syslog
propagate=1

[handler_console]
class=StreamHandler
level=DEBUG
formatter=automation_scripts
args=(sys.stdout,)

[handler_syslog]
class=SyslogHandler
formatter=automation_scripts
args=(address=('10.10.10.41', 514),)

[formatter_automation_scripts]
format=[%(asctime)s.%(msecs)03d] [%(levelname)s] [%(filename)s] [%(funcName)s():%(lineno)s] [PID:%(process)d TID:%(thread)d] %(message)s
datefmt=%d/%m/%Y %H:%M:%S
Then I loaded this config file as one of the first things in each of my scripts:
logging.config.fileConfig(os.path.realpath(os.path.dirname(os.path.realpath(__file__)) + "/logger.conf"))

logger = logging.getLogger(__name__)
And “print()” statements went from something like this:
print(f"? Created a host record for {name} > {ip} in {domain} for {dname}")
To something like this:
logger.info(f"? Created a host record for {name} > {ip} in {domain} for {dname}")
(Yeah, I use emojis in the messages to make it easier to spot errors and changes when a human is reading.)
The console output is also enriched. It went from simply:
? Created a host record for tst01-z0-ext-auth-dns-01 > 10.10.10.11 in ext-test01.example.com. for tst01-z0-vm-ext-auth-dns-01
To this:
[14/04/2021 19:50:25.603] [NOTICE] [netbox-to-cpnr.py] [add_host():156] [PID:32080 TID:140408831067904]
? Created a host record for tst01-z0-ext-auth-dns-01 > 10.10.10.11 in ext-test01.example.com. for tst01-z0-vm-ext-auth-dns-01
While not as beneficial to the user running the script manually, the added timestamp and the name of the script are invaluable in a consolidated log of all changes to the infrastructure. The associated function and line number also help track down problems if something isn’t behaving quite right. Note the “%(msecs)03d” notation in the log format. Having millisecond granularity in your timestamps aids in debugging, as well as in comparing order of operation between multiple systems or scripts (just make sure all your machines use an NTP time source).
All together, this configuration displays message on the console, as well as sends them to our centralized logging server via syslog. Therefore, our overall monitoring system includes the messages from our network devices, our infrastructure applications, and our automation scripts.
Sprinkling In Some ChatOps
Syslog logging is nice and gives us that historical audit trail and forensic account of what is going on. But what if immediate action or notification is required? Sure, our syslog receiver software (we’re using syslog-ng) supports running scripts upon reception of certain messages. This is fine for centralizing trends and generating alerts based on multi-event correlation. However, if you know when writing the application (or script in this case) that you want operations to be notified, you can certainly do it from the app itself.
Given that flexible Python logging system I mentioned, I wanted to add a handler that could send messages via the Webex incoming webhooks framework. Incoming Webhooks make it easy to send messages from your app to a Webex space. You don’t need to create a bot or get the Team or Room ID ahead of time. Instead, you associate an incoming webhook with a space of your choice via the web, and then use the webhook token when sending your messages.
I registered a few webhooks for the various automation scripts I was building, and then cooked up a fairly simple Python logging handler, WebexHandler. With this module installed, I added the following block to my logger.conf and connected it to the root logger:
[handler_webex]

class=webex_handler.WebexHandler

formatter=elemental_scripts

args=('https://webexapis.com/v1/webhooks/incoming/MY_TOKEN_HERE',)
As soon as I re-ran my script, I saw the following:
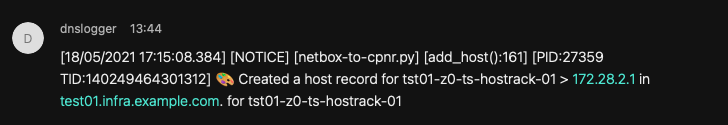
But as my script started generating more messages, I started seeing the following on the console:
Traceback (most recent call last):
File "/home/jclarke/venvs/venv_nb/lib/python3.9/site-packages/webex_handler/webex.py", line 57, in emit
r.raise_for_status()
File "/home/jclarke/venvs/venv_nb/lib/python3.9/site-packages/requests/models.py", line 943, in raise_for_status
raise HTTPError(http_error_msg, response=self)
requests.exceptions.HTTPError: 429 Client Error: Too many requests for url: https://webexapis.com/v1/webhooks/incoming/...
Which makes sense since the Webex APIs rate limit requests. But handling back-off in the logging is tricky since you don’t want to block application progress waiting to send a message. Ultimately, I added threading support so messages are delivered asynchronously (but still maintain their initial timestamp). And while I wasn’t writing async code, I also implemented an asyncio version of the handler for those that might be.
Summing Up
I hope this post gets you thinking about how you’re logging in your network automation projects. While you might not use syslog or Webex, there are so many different ways of logging messages that you will find something that works for you.
Just be careful that you don’t log too much via Webex. You want to manage by exception, not flood your operators with messages they will learn to ignore. I added a “NOTICE” level that sits between INFO and WARNING so I have a bit more granularity on what gets logged.
Got questions or comments about this post? Reach out to me on email, or post in the comments field here.
And be on the lookout for my next post on how we did DNS automation out of NetBox.
In the meantime, you can check out all the resources available for developing with Python on Cisco platforms.
We’d love to hear what you think. Ask a question or leave a comment below.
And stay connected with Cisco DevNet on social!
Twitter @CiscoDevNet | Facebook | LinkedIn
Visit the new Developer Video Channel


Wonderful post! It has motivated me to implement logging in my python scripts and start exploring connectivity with the WebEx API.
Thanks Joe for sharing!
awesome