
One Ring to rule them all,
One Ring to find them,
One Ring to bring them all
and in the light unite them.
― with a tip of the hat to J.R.R. Tolkien
Hierarchy and Federation have been the concepts on which most of the complex problems in large scale distributed systems have been solved. Network management in the hybrid cloud is no exception to this. Data Center network deployments have evolved from a 3-Tier Access-Aggregate-Core hierarchical topology to a CLOS/Fat-Tree-Based Spine-Leaf Multi-Tier topology that maximizes scalability. My previous blog post Designing Fault Tolerant Data Centers of the Future addressed how hierarchy can be employed to scale configuration and policy orchestration of data center deployments across multiple sites. This post highlights how to unify Day-2 operations insights across multiple data center sites using a federated approach.
With Massively Scalable Data Centers (MSDC) and geographically distributed applications becoming a reality, scalability of network management and network operations is going through a revolution. IT can expand data centers by adding additional server racks with their associated ToR switches. To expand even more, IT adds rows of racks and additional interconnect switches known as spines. And once rack capacity in a single data hall or site is reached, IT can add additional sites and interconnect them using multi-site orchestration. Each of these sites typically operate independently while having a peer-to-peer relationship with other member sites. This loose coupling yields a more flexible federated model that enables large-scale deployments that span across multiple geographical locations. Cisco supports both hierarchical and federated approaches to scaling—the former with Nexus Dashboard Orchestrator and the latter with Nexus Dashboard Insights.
In a nutshell then, the networking problem from both a control plane and data plane perspective has been well understood and solved to a large extent. However, with application architecture requirements becoming more complex, and service level agreements for applications becoming more stringent, the management plane is undergoing its own transformation to meet the ever-increasing demands of enterprise hybrid cloud operations.
One Pane to View Them All
Enter Nexus Dashboard One View. Whether the challenge is managing the network and associated entities in on-premises private cloud or a combination of public and private cloud environments (multi-cloud), IT has been on a quest for a unified management and observability entity. A Single-Pane-Of-Glass design provides the ability to login once with authorized credentials and view all the anomalies or issues of all the networks being managed that require immediate attention. IT Ops can remediate the issues from one screen without having to login to different entities. Nexus Dashboard One View also provides a context-driven portal into network controllers and orchestrators for deep troubleshooting. With Nexus Dashboard One View, there is no need to login to multiple applications and search with different tools to track down specific network problems.
Cisco Nexus Dashboard One View Rules Over the Management Plane
Cisco Nexus Dashboard combines Insights, Orchestrator, Data Broker, and third-party services to give NetOps and DevOps teams an intuitive view of multiple data center fabrics. It provides the ability for NetOps to focus on critical anomalies, pin-pointing root causes and providing remediation suggestions that can be implemented with a single click.
With Nexus Dashboard One View, it doesn’t matter whether the network is being monitored by N distinct Nexus Dashboard clusters or a single stretched large cluster. The Nexus Dashboard cluster nodes can be deployed on physical or virtual appliances. Virtual appliances can be deployed on compute nodes that are hosted in the on-premises data center or in the public cloud. Moreover, a given Nexus Dashboard cluster can consist of a mix of physical compute nodes; virtual nodes in on-premises data centers; and virtual nodes in public clouds. Nodes can also have different form factors in terms of CPU, memory, and storage. Nexus Dashboard One View provides a single cohesive view of all the sites being managed and the services installed across Nexus Dashboard clusters.
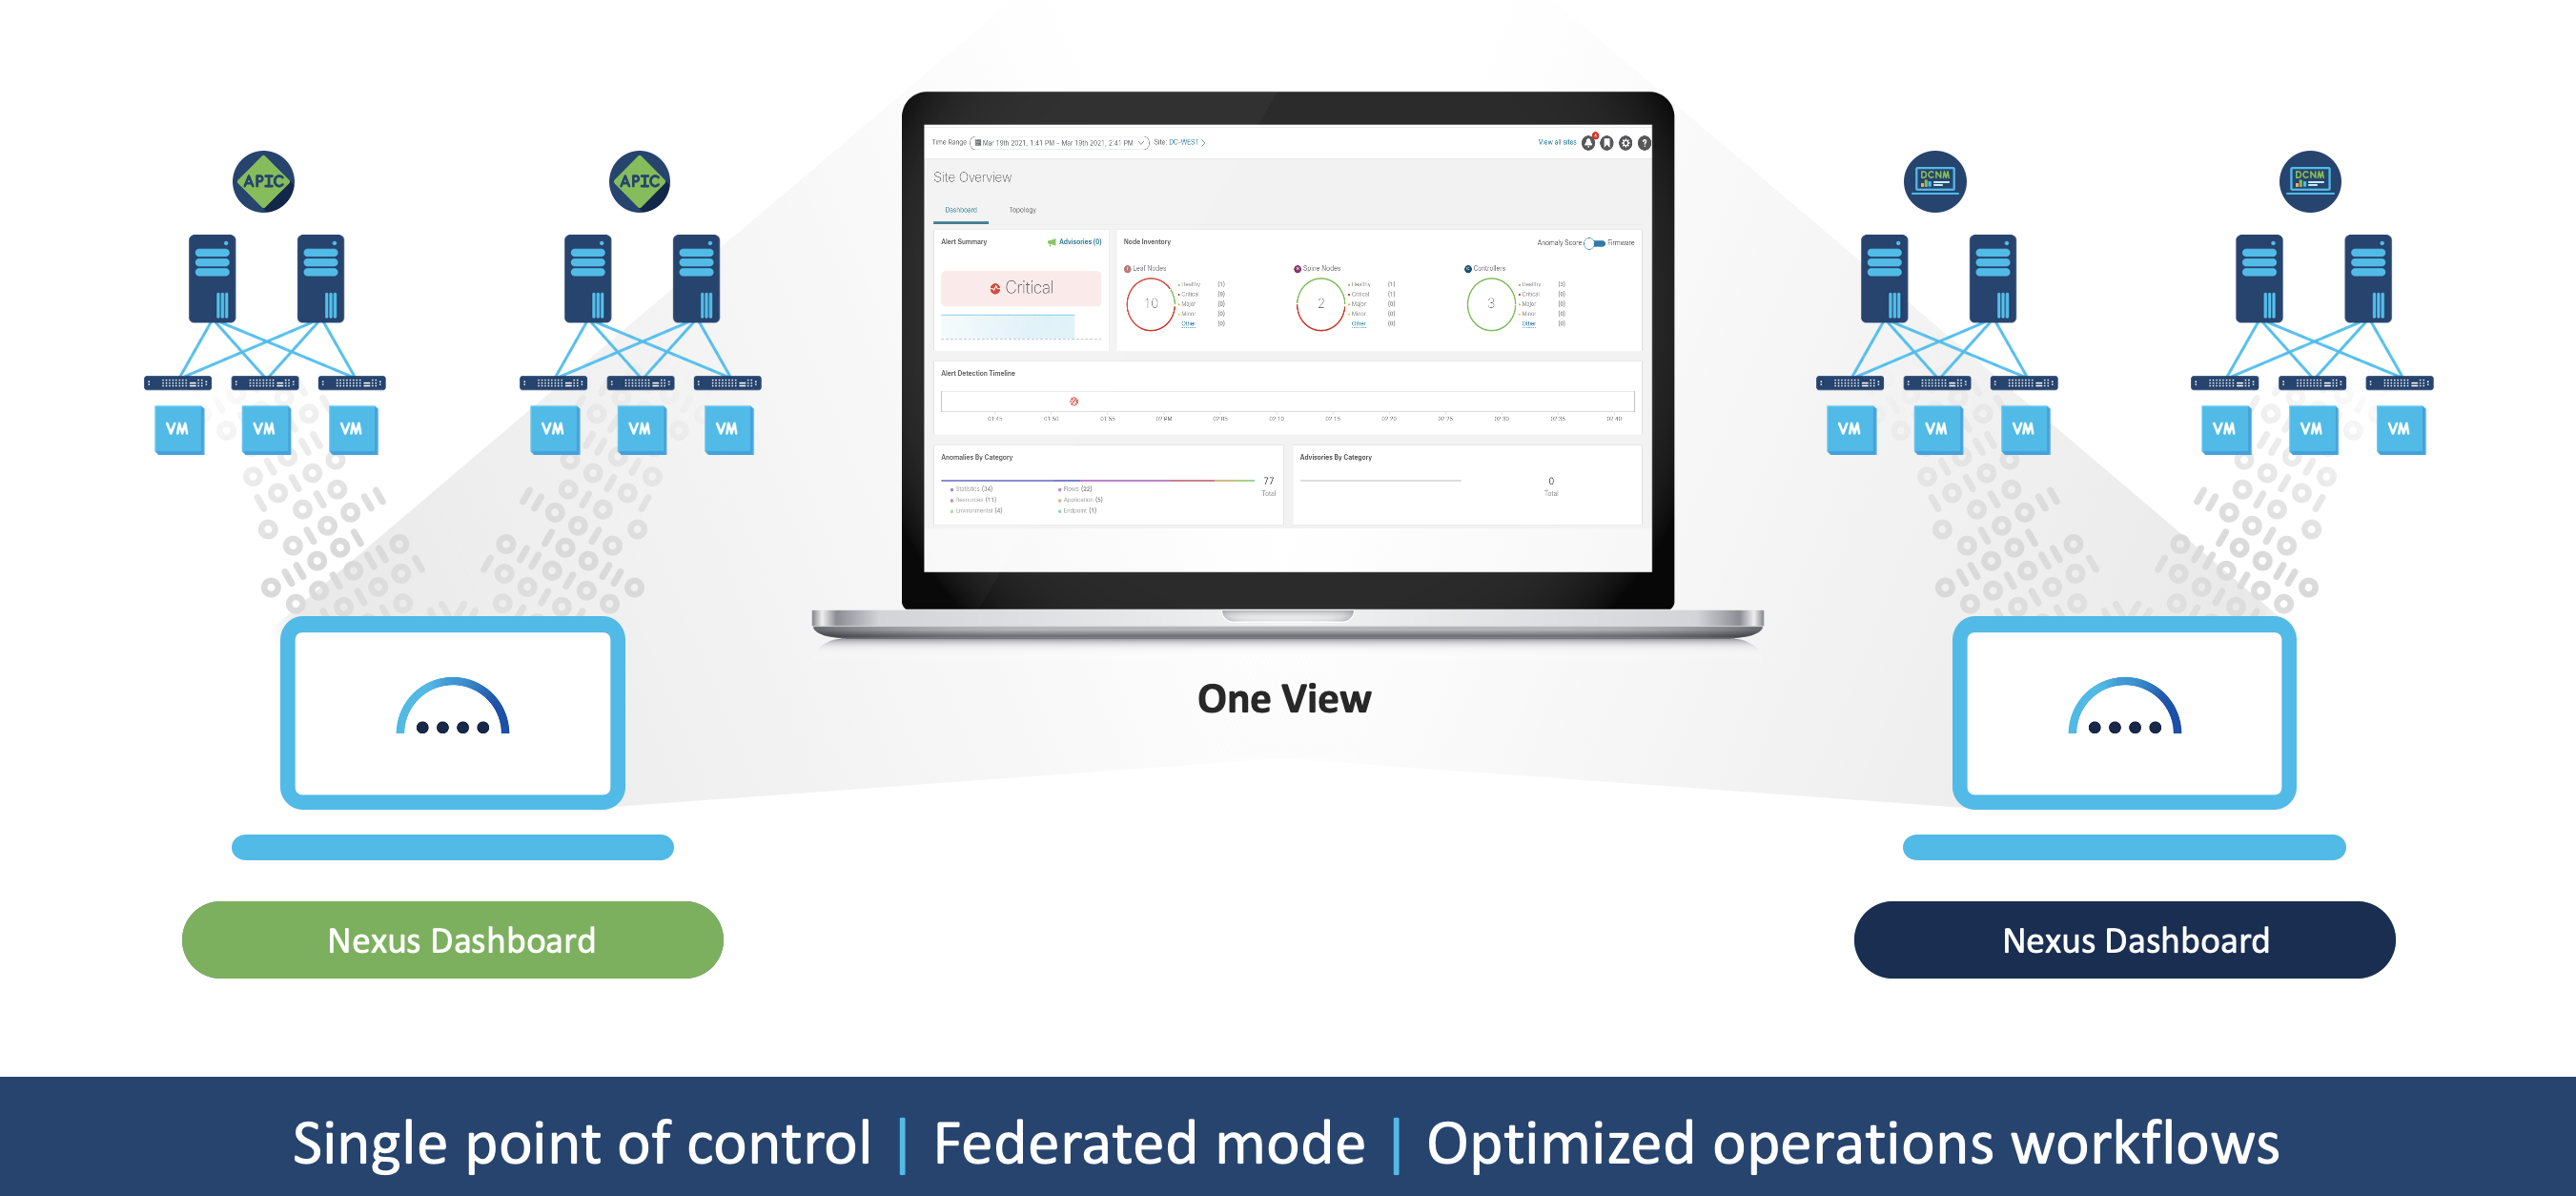
ITOps is completely abstracted from the geographic location of the networks or the services with which they are interacting. While each site is managed individually to meet local data privacy regulations, One View manages and aggregates all the dashboards. With One View, ITOps gets a single pane interface for all network insights including the ability to author network policies for distributed network sites and create custom workflows.
Cross-site correlation and insights derived from the federated data lake and the ability to create workflows across services and sites spanning multiple Nexus Dashboard clusters highlights a key industry-first innovation. Sites can span across different geographical locations or, in some cases, are co-located but have different administrative boundaries. A site-group, consisting of multiple interconnected sites, particularly requires unified orchestration and insights for enhanced configuration, policy management, and troubleshooting to deal with the increased complexity. The ability to have granular change control options for operational and configuration workflows at per-site, inter-site, and site-group levels is extremely critical. All these controls are built into the Nexus Dashboard One View.
Cisco Nexus Dashboard OneView is truly a unique platform that:
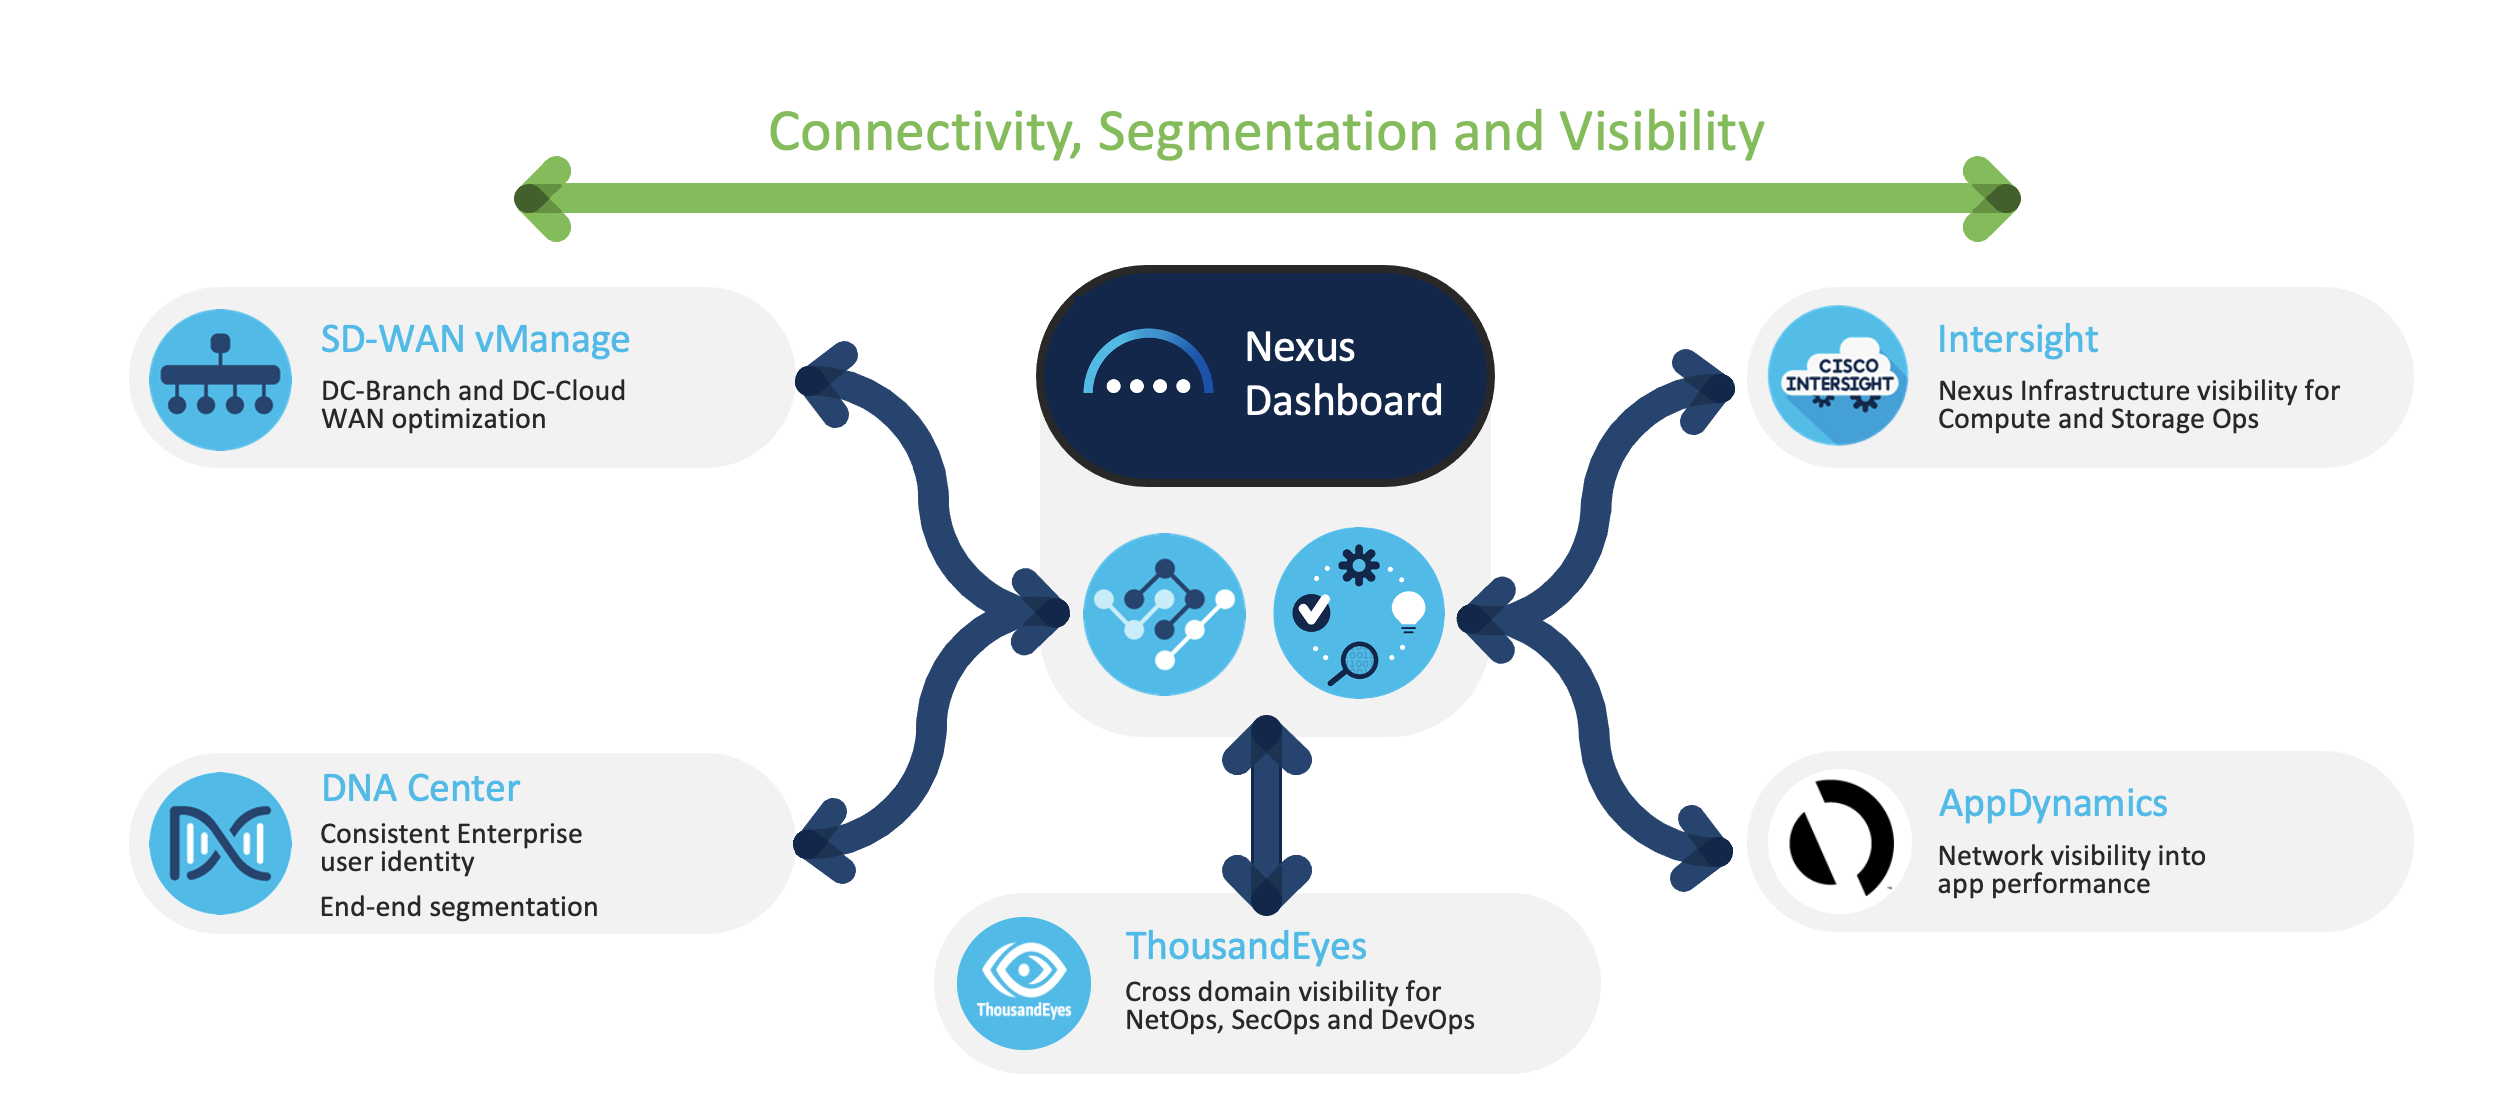
- Hosts Cisco services for orchestration, control, and insights while providing a single interface to other domain controllers for campus and WAN integration.
- Provides a unified integration with ThousandEyes to extend observability into the rich intra-data center granular traffic flow across the WAN and DCI links for key correlated insights.
- Correlates application performance to the network performance with deep integration between Nexus Dashboard and AppDynamics.
- Provides an open platform with rich API support for seamless integration with existing tools such as third-party services like ServiceNow, DDI solutions like Infoblox, and VM Orchestrators such as VMware vCenter.
With Cisco Nexus Dashboard, One View is no longer a myth but a reality. Cisco One View rules them all.
Resources:
Designing Fault Tolerant Data Centers of the Future
Register now for the Hybrid Cloud Demo Series webinar to see One View at work!


Nice Article!!
Good One. Good overview of Nexus Dashboard capabilities and the direction it is headed in.
One View…..my precious!
For MSDC, Cisco One View is imperative. Nice article!
Very colorful, wonderful blog!
The power of ”Hybrid cloud” & Ruling, nexus dash board, cluster role, hosts &co-hosts & capabilities of successful webinar meat, thanks to given this opportunity for me & Glad to share these words with organization.