
We have all heard the maxim “Life Imitates Art”. It might also be true that Life imitates IT operations as well. A recent personal experience led me to a new perspective on how important it is to have proper Day 2 Operations Tools in the data center. In this blog post, I refer specifically to Nexus Dashboard Insights as the tool of choice for ACI and NXOS DC fabrics.
About a year ago, I was having an issue with one of my eyes. It didn’t hurt, so I was slow in getting it examined. Imagine my surprise when my doctor finally told me that this was something we really needed to pay attention to.
The first big question all doctors face when diagnosing anything is “What could be the cause of this?” There is very little that can be done to treat any problem before arriving at this understanding. What began as a simple doctor visit quickly evolved into a seemingly endless series of tests across a whole range of specialists. When you don’t know, you start gathering data. The working diagnosis was focused on rapidly getting to the bottom of the root cause.
After all the tests, and all the appointments, we ended up weeks later with a rather large amount of data about my physiology. What did it all mean? Who could look at it and make some sense of it? Could we determine the root cause? Could any conclusions be quickly reached to move on to the thing I cared most about—fixing the problem?
As I was immobilized during an MRI, I could not help but make the correlation that all these tests, all this data, and all these different doctors have their analogues in the world of datacenter networking and operations.
Problem: Too Much Information!
When anything falls out of the norm in a data center, there is a certain process, or lifecycle that our operations teams go through. Much like a doctor seeking a diagnosis, we first spend time—often too much time—just trying to understand what the problem is. We cannot move forward in a reliable way without first arriving at a root cause—or at least a reasonable hypothesis. Meanwhile, business operations suffer.
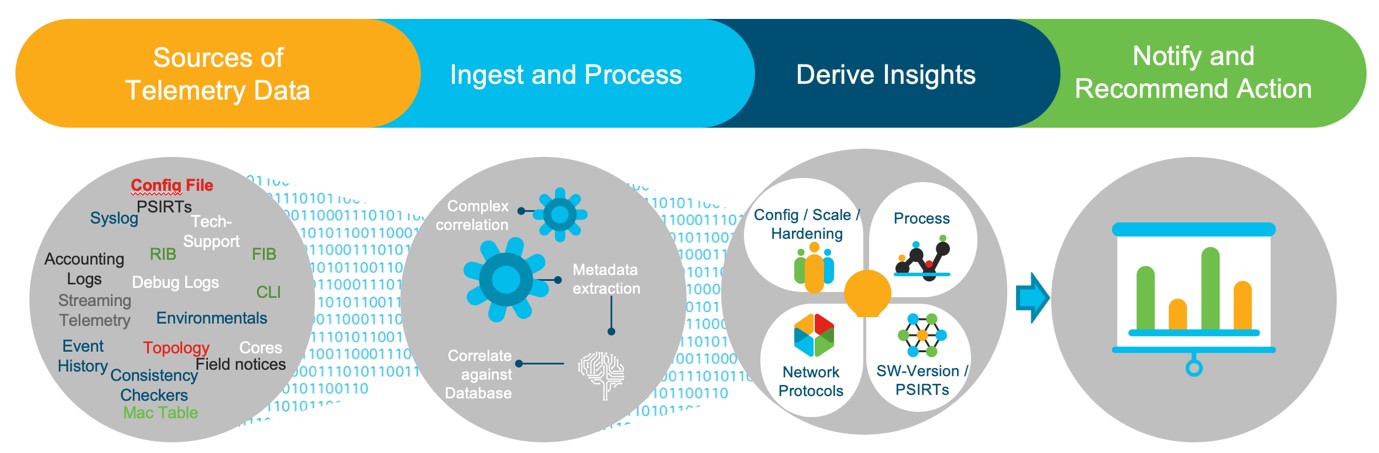
Answering this first question is only the first step on the path. Next, we need to have some understanding as to the scope of the problem. Why is it happening? Where is it happening? Who or what is being impacted? When did it start? Is it still happening? This also takes time—and often under stressful conditions. IT Operations will be frantically gathering data and information from any source they can think of. The data is certainly out there, but too many times we suffer from an overwhelming amount of it—think syslog. Add faults, events, alerts, pings, CLI commands, interface counters, routing information, environmental data, so many others.
Now, multiply that level of telemetry in a datacenter where there may be hundreds of interconnected devices that might be playing a role in the issue. It’s endless. All these systems, all the data; the vast majority of it uncorrelated, is coming from different tools from different eras that just weren’t built to understand the big picture.
Making sense of it becomes not just a technical challenge but one that impacts the business.
Fast Forward to Fixing Issues with Nexus Dashboard Insights
The IT Operations team—our DC doctors—are now asking themselves a new question. In this sophisticated world of so many interconnected moving parts, is there a way can we fast-forward to the “fixing” part of the lifecycle as quickly as we can? To answer that requires a useful set of tools built to address the needs of the modern datacenter. The business demands it.
This is exactly the reason why Cisco developed Nexus Dashboard Insights.
Nexus Dashboard Insights is a multi-functional “right set of tools” built to receive multiple and varied sources of data from the datacenter fabric. That part is easy. The value begins to show itself in what happens next. Nexus Dashboard Insights is a powerful correlation engine. It has intelligence derived from machine learning to know how the data is related to other data. What’s more, it is doing this in the context of the entire fabric and on a continual basis, not just one moment in time. Impressive! Let’s keep going.
Nexus Dashboard Insights excels at analyzing these relationships and trends over time and comparing it to baselines that define the boundaries of normal operation, best practices, and a healthy state. This is heavy work for humans, but trivial for Nexus Dashboard Insights.
We are not done yet.
I mentioned earlier that the question we are trying to answer is how to fast-forward to the “fixing part” of this lifecycle. Based on everything Nexus Dashboard Insights knows about the state and operation of the data center environment, it can move us to concrete action in a form that is easily consumable to humans. This is the “fixing part” presented as a very deterministic set of actions operators need take in the context of a specific environment. This is to say, the important questions of what, where, why, and how are answered quickly. Because Nexus Dashboard Insights has done all the heavy lifting at a very rapid pace, in the scope of the whole fabric, the Mean Time To Resolution (MTTR) of any issue has shrunk an order of magnitude.
 Let’s pause for moment and consider what that means to businesses. Downtime costs real money. The longer it goes on, the more it costs. By having an intelligent toolset in Nexus Dashboard Insights, we can be quickly made aware of issues, resolve them faster, and thus ultimately protect the business. Therein lies the value of Nexus Dashboard Insights. IT can move faster, with more situational awareness and get on to the fixing stage much sooner. That is good for the business and good for the IT Operations team tasked with keeping the infrastructure healthy and running optimally.
This is just one major use case scenario. What if these tools could even begin to predict or spot issues before they actually impact the business? That would certainly be worth the price of admission many times over. Nexus Dashboard Insights is blazing a trail here too, but that is content for a future blog post.
Without these tools, what are the alternatives? Do we just leave it to luck? Can businesses afford to take such a chance? We all know the answer to this is no.
We know our world may be imperfect but having the right tools at the right time goes a long way toward making this better.
For more information visit the Cisco Nexus Dashboard Insights web site.


its very interesting information for me to update my knowledge
Cisco Nexus Dashboard is very helpful to manage complicated and big network.
This is comprehensive and well structured. Thanks for sharing.
thanks for providing information for that
Amazing, thanks for sharing
its very interesting information for me to update my knowledge
iIs very interesting information for me, Danke
Great Article
Great summery of telemetry.
Great Information to share with us
Great Information to share with us.
iIs very interesting information for me, Danke
its very interesting information for me to update my knowledge
This is very informative. Thanks for sharing!!
Great tools indeed.
I especially like that this way we’re solving issues before the user even notice them.
iIs very interesting information for me, Danke
This was really some very interesting information. Thank you so much for sharing.
Its very useful information.
Its very interesting topic.
Its very interesting information.
Nice information which help me in future life
Its useful for me. thanks for sharing.
Thanks for sharing information, its useful..