
Transmission and Telemetry
The word transmission may spark different thoughts in each of us. We may think about transmission of electromagnetic waves from transmitter to receiver like in a radio or television. Perhaps we think of automobile transmission. In the world of networking, transmission commonly refers to transmitting and receiving packets between source and destination. This brings us to the focus of this article – transmission of telemetry data.
I am excited to share a few new developments we have in the area, especially with streaming telemetry on Nexus switches. Telemetry involves the collection of data from our switches and their transmission to a receiver for monitoring. The ability to collect data in real time is essential for network visibility, which in turn helps in network operations, automation and planning. In this article, we introduce gNMI with OpenConfig that is used to stream telemetry data from Nexus switches. We also introduce the open source time series data collection agent, Telegraf, which is used to consume our telemetry data. The word telegraph, as some may recall, was a system for transmitting messages from a distance along a wire. Let us take a look at our modern take on it, and how far we have come from Morse codes to JSON encoding!
Evolution of gRPC, gNMI and OpenConfig on our switches
There are different network configuration protocols available on Cisco Nexus switches, including NETCONF, RESTCONF and gNMI. All of these protocols use YANG as a data model to manipulate configuration and state information. Each of these protocols can use a different encoding and transport. For the purposes of this article, we will be focusing on gRPC Network Management Interface (gNMI) which leverages the gRPC Remote Procedure Call (gRPC) framework initially developed by Google. gNMI is a unified management protocol for configuration management and streaming telemetry. While NETCONF and RESTCONF are specified by the IETF, the gNMI specification is openly available at the OpenConfig GitHub account.
Cisco Nexus switches introduced telemetry over gRPC using a Cisco proprietary gRPC agent in NX-OS Release 7.x. The agent called “gRPCConfigOper” was used for model-driven telemetry. This was based on a dial-out model, where the switch pushed telemetry data out to telemetry receivers.
With NX-OS Release 9.3(1), we introduced a gNMI agent which also offers a dial-in subscription to telemetry data on the switch. This allowed a telemetry application to pull information from a switch with a Subscribe operation. The initial implementation of gNMI Subscribe was based on the Cisco Data Management Engine (DME) or device YANG which is specific to Cisco Nexus switches.
In order to have a fully open gNMI specification, we added OpenConfig support with gNMI. gNMI defines the following gRPC operations: CapabilityRequest, GetRequest, SetRequest and SubscribeRequest. Cisco NX-OS Release 9.3(5) supports the complete suite of gNMI operations with Capability, Subscribe, Get and Set using OpenConfig. Cisco NX-OS 9.3(5) is based on gNMI version 0.5.0.
While these may seem like incremental enhancements, that is far from the case. This new method of telemetry enables us to stream telemetry to multiple collectors, both in-house as well as within the open source community, as we will see in this article.
Telemetry on Cisco Nexus Switches
The two methods of streaming telemetry described above can be implemented by enabling specific features globally on Cisco Nexus switches.
- Dial-out telemetry is enabled with “feature telemetry”.
- Dial-in telemetry with gNMI is enabled with “feature grpc”.
Telegraf
Telegraf is an open-source server agent used for collecting and reporting metrics and events. It was developed by the company InfluxData. It uses various input plugins to define the sources of telemetry data that it receives and processes. It uses output plugins which control where it sends the data, such as to a database. With the appropriate input plugins in place, Telegraf is able to subscribe to a switch or switches and collect telemetry data over gNMI or other protocols. It can send this data to a time series database called InfluxDB. The data can then be rendered with an application called Chronograf. The different components are summarized below:
-
Telegraf: a server agent for collecting and reporting metrics
-
InfluxDB: a time series database
-
Chronograf: a GUI (graphical user interface) for the InfluxData platform which works on templates and libraries
-
Kapacitor: a data-processing engine
In my example below, I’ve leveraged the first three components of the stack for viewing telemetry data. Cisco has released specific plugins for gNMI and MDT (model-driven telemetry) for Telegraf which are packaged along with the product.
How can I get it to work?
Step 1: Set up your environment
In the example below, the setup is entirely virtual and is built with just two devices: A Nexus 9300v switch running 9.3(5) and an Ubuntu server running 18.04 LTS. You could set up the same environment with any Nexus switch with reachability to a host.
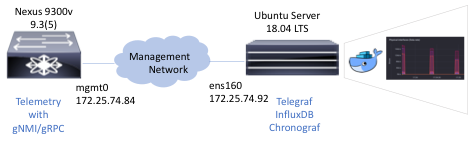
The Nexus 9300v is a new ToR (Top-of-Rack) simulation of the Nexus 9000 series switches that can be used as a virtual appliance with VMware ESXi/Fusion, Vagrant or KVM/QEMU. It requires no licenses and can be used for demo or lab purposes to model a Nexus 9000 environment. In this example, I used an OVA to deploy my switch on a VMware ESXi host. Once the installation is complete and the switch can be accessed over console or SSH, the appropriate RPM packages for OpenConfig need to be installed on the switch, which can be downloaded from the Cisco Artifactory portal, under “open-nxos-agents”.
After the file “mtx-openconfig-all-<version>.lib32_n9000.rpm” is copied onto the switch bootflash, it needs to be installed on the switch as below:
n9300v-telemetry# install add mtx-openconfig-all-1.0.0.182-9.3.5.lib32_n9000.rpm activate
Adding the patch (/mtx-openconfig-all-1.0.0.182-9.3.5.lib32_n9000.rpm)
[####################] 100%
Install operation 1 completed successfully at Fri Jul  3 02:20:55 2020

Activating the patch (/mtx-openconfig-all-1.0.0.182-9.3.5.lib32_n9000.rpm)
[####################] 100%
Install operation 2 completed successfully at Fri Jul  3 02:21:03 2020

n9300v-telemetry# show version
<---snip--->
Active Package(s):
 mtx-openconfig-all-1.0.0.182-9.3.5.lib32_n9000
n9300v-telemetry#
Step 2: Configure your server with Telegraf
There are two ways to install Telegraf. One method would be to install Telegraf, InfluxDB and Chronograf within Docker containers on the host. The other method is to install them natively on the host using the Telegraf repository to install the component packages. This is the method that I followed in my example. There are many tutorials available for Telegraf installation, so I will reference the InfluxData documentation for this step. Once the services have been installed, you can verify their operational status or start/stop/restart services the using the following commands.
systemctl status telegraf
systemctl status influxdb
systemctl status chronograf
The two plugins cisco_mdt_telemetry (the Cisco model-driven telemetry plugin) and gnmi (the Cisco gNMI plugin) are integrated into the Telegraf release, and no specific configuration is required to install them. The cisco_mdt_telemetry plugin is based on dial-out telemetry or a push model. The gnmi plugin is based on dial-in telemetry or a pull model, which is what we explore in this example.
Step 3: Configure your switch
Telemetry using gRPC and gNMI can be enabled by the command “feature grpc”. The other gRPC configuration is summarized below.
n9300v-telemetry# show run grpc

!Command: show running-config grpc
!No configuration change since last restart
!Time: Tue Jul 14 16:56:37 2020

version 9.3(5) Bios:version
feature grpc

grpc gnmi max-concurrent-calls 16
grpc use-vrf default
grpc certificate gnmicert

n9300v-telemetry#
The max-concurrent-calls argument applies specifically to the new gNMI service and allows a maximum of 16 concurrent gNMI calls. The gRPC agent serves only the management interface by default. Adding the “use-vrf default” command allows it to accept requests from both the management and the default VRF.
Optionally, we can also configure gNMI to use a specific port for streaming telemetry. The default port is 50051.
n9300v-telemetry(config)# grpc port ?
    Default 50051
Telemetry with gNMI uses TLS certificates to validate the client-server communication. In my example, I used a self-signed certificate and uploaded it onto the server and the switch. The gNMI/gRPC agent on the switch is then set to honor the certificate. On the server side, the Telegraf configuration file (covered in the next section) is set to point to the certificate.
For the switch side of the configuration, the configuration guide covers the required steps. There are two methods that can be followed. The first method is available in older releases and consists of copying the .pem file onto bootflash and manually editing the gRPC configuration file to use the .pem and .key file.
The second method was introduced with NX-OS Release 9.3(3) and is our recommended way of installing certificates. It consists of generating a public and private key pair and embedding them in a certificate that is associated with a trustpoint. The trustpoint is then referenced in the grpc certificate command above.
n9300v-telemetry# run bash sudo su
bash-4.3# cd /bootflash/
bash-4.3# openssl req -newkey rsa:2048 -nodes -keyout gnmi.key -x509 -days 1000 -out gnmi.pem
bash-4.3# openssl pkcs12 -export -out gnmi.pfx -inkey gnmi.key -in gnmi.pem -certfile gnmi.pem -password pass:abcxyz12345
bash-4.3# exit
n9300v-telemetry(config)# crypto ca trustpoint gnmicert
n9300v-telemetry(config-trustpoint)# crypto ca import gnmicert pkcs12 gnmi.pfx abcxyz12345
n9300v-telemetry(config)# grpc certificate gnmicert
The certificate can be verified using the command “show crypto ca certificates”. In my example, I copied the public key gnmi.pem from the switch bootflash to the host running Telegraf into the default configuration folder /etc/telegraf.
Step 4: Edit the configuration file in Telegraf
Now we get to the key piece of the puzzle. Telegraf uses input and output plugins. The output plugins are a method for sending data to InfluxDB. The input plugins are used to specify different sources of telemetry data that Telegraf can subscribe to receive data from, including our Cisco Nexus switch.
Here is the configuration for the output plugin. We ensure that we are pointing to our server IP address, and setting up a database name and credentials for InfluxDB. This information will be fed into Chronograf.
Most of the fields are left as default, but a few parameters are edited as seen below.
# Configuration for sending metrics to InfluxDB
[[outputs.influxdb]]
   urls = ["http://172.25.74.92:8086"]
   database = "telemetrydb"
   username = "telemetry"
   password = "metrics"
Here is the configuration for the input plugin, where we enter our switch details. Cisco has released two plugins with Telegraf, the MDT plugin and the gNMI plugin. For this exercise, we will be focusing on the gNMI plugin which is integrated into Telegraf when you install it. Note that our path specifies an origin of “openconfig”. The other options are to use device or DME as the origin and path for our gNMI subscription. The encoding can also be specified here. Please see the Cisco Nexus Programmability Guide for supported encoding formats with gNMI for the release you are working with. The examples below reference the plugin “cisco_telemetry_gnmi” which has since been renamed to “gnmi” in future Telegraf releases since it works with other vendors that support gNMI.
 [[inputs.cisco_telemetry_gnmi]]
  ## Address and port of the GNMI GRPC server
  addresses = ["172.25.74.84:50051"]
  #  addresses = ["172.25.238.111:57400"]
  ## define credentials
  username = "admin"
  password = "abcxyz12345"

  ## GNMI encoding requested (one of: "proto", "json", "json_ietf")
   encoding = "proto"

  ## enable client-side TLS and define CA to authenticate the device
   enable_tls = true
   tls_ca = "/etc/telegraf/gnmi.pem"
   insecure_skip_verify = true

[[inputs.cisco_telemetry_gnmi.subscription]]
 ## Name of the measurement that will be emitted
 name = "Telemetry-Demo"

 ## Origin and path of the subscription
    origin = "openconfig"
    path = "/interfaces/interface/state/counters"
Step 5: Set up Chronograf and start Telegraf
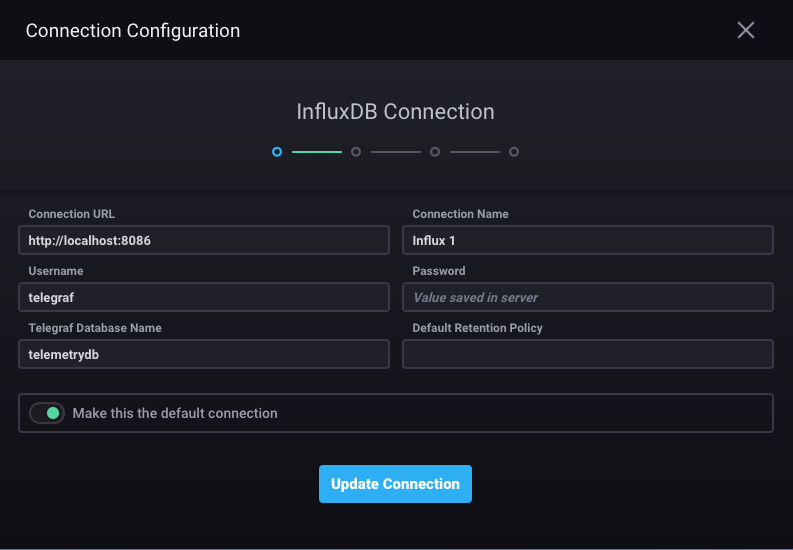
Browse to your server IP port 8888 to see the beautiful view of your time series telemetry data! Chronograf can be accessed as shown in the picture below. The settings icon on the left will need to be used to point to the InfluxDB database that you selected in the output plugin section of your Telegraf configuration file.
In Step 4 where we edit the Telegraf configuration file in the folder /etc/telegraf on the host, I created a new configuration file that I edited so as not to modify the original configuration file. I called this file telegraf_influxdb.conf. When I start telegraf, I can do so by specifying this particular configuration file. As you can see below, the cisco_telemetry_gnmi plugin (later renamed to gnmi) is loaded.
dirao@dirao-nso:/etc/telegraf$ sudo /usr/bin/telegraf -config /etc/telegraf/telegraf_influxdb.conf -config-directory /etc/telegraf/telegraf.d/
[sudo] password for dirao:
2020-07-15T00:33:54Z I! Starting Telegraf 1.14.4
2020-07-15T00:33:54Z I! Loaded inputs: cisco_telemetry_gnmi
2020-07-15T00:33:54Z I! Loaded aggregators:
2020-07-15T00:33:54Z I! Loaded processors:
2020-07-15T00:33:54Z I! Loaded outputs: influxdb file
2020-07-15T00:33:54Z I! Tags enabled: host=dirao-nso
2020-07-15T00:33:54Z I! [agent] Config: Interval:10s, Quiet:false, Hostname:"dirao-nso", Flush Interval:10s
{"fields":{"in_broadcast_pkts":0,"in_discards":0,"in_errors":0,"in_fcs_errors":0,"in_multicast_pkts":0,"in_octets":0,"in_unicast_pkts":0,"in_unknown_protos":0,"out_broadcast_pkts":0,"out_discards":0,"out_errors":0,"out_multicast_pkts":0,"out_octets":0,"out_unicast_pkts":0},"name":"Telemetry-Demo","tags":{"host":"dirao-nso","name":"eth1/14","path":"openconfig:/interfaces","source":"172.25.74.84"},"timestamp":1594773287}
{"fields":{"penconfig:/interfaces/interface/name":"eth1/14"},"name":"openconfig:/interfaces","tags":{"host":"dirao-nso","name":"eth1/14","path":"openconfig:/interfaces","source":"172.25.74.84"},"timestamp":1594773287}
{"fields":{"in_broadcast_pkts":0,"in_discards":0,"in_errors":0,"in_fcs_errors":0,"in_multicast_pkts":0,"in_octets":0,"in_unicast_pkts":0,"in_unknown_protos":0,"out_broadcast_pkts":0,"out_discards":0,"out_errors":0,"out_multicast_pkts":0,"out_octets":0,"out_unicast_pkts":0},"name":"Telemetry-Demo","tags":{"host":"dirao-nso","name":"eth1/9","path":"openconfig:/interfaces","source":"172.25.74.84"},"timestamp":1594773287}
Step 6: Verify and Validate gNMI on the switch
Verify gNMI/gRPC on the switch as below to check the configured gNMI status with certificate registration and to verify that the gNMI subscription was successful.
n9300v-telemetry# show grpc gnmi service statistics

=============
gRPC Endpoint
=============

Vrf            : management
Server address : [::]:50051

Cert notBefore : Jul 10 19:56:47 2020 GMT
Cert notAfter  : Jul 10 19:56:47 2021 GMT

Max concurrent calls            :  16
Listen calls                    :  1
Active calls                    :  0

Number of created calls         :  4
Number of bad calls             :  0

Subscription stream/once/poll   :  3/0/0

Max gNMI::Get concurrent        :  5
Max grpc message size           :  8388608
gNMI Synchronous calls          :  0
gNMI Synchronous errors         :  0
gNMI Adapter errors             :  0
gNMI Dtx errors                 :  0
<---snip--->
n9300v-telemetry#

n9300v-telemetry# show grpc internal gnmi subscription statistics  | b YANG
1              YANG                 36075             0                 0

2              DME                  0                 0                 0

3              NX-API               0                 0                 0
<---snip--->
Note the output above showing the gRPC port number and VRF in use. It also shows that the certificate is installed successfully with the dates of the Cert being indicated. The second command output shows hits on the statistics for YANG every time we have a successful gNMI subscription, since gNMI uses the underlying YANG model.
Step 7: Visualize time-series telemetry data on Chronograf
Navigate to the measurement you specified in your Telegraf configuration file, and enjoy your new graphical view on Chronograf!


The above output shows interface statistics collected by gNMI for unicast packets in and out of a particular interface that has traffic going on it. The data can be viewed and further modeled using queries to make it more granular and specific.
I hope you found this post useful to understand how with this latest feature, NX-OS is positioned to work with a variety of streaming telemetry receivers with a fully open model that can be customized and fine-tuned to fit your needs!
References
- Network Programmability with YANG: The Structure of Network Automation with YANG, NETCONF, RESTCONF, and gNMI – Benoit Claise, Joe Clarke, Jan Lindblad
- OpenConfig gNMI specification on GitHub
- Telegraf overview and plugins


