
In this ‘Focus on HyperFlex’ blog, we’ll zero-in on different aspects of the Cisco HyperFlex (‘HX’) hyperconverged system and ways to make HX work best for you and your organization. This edition will illustrate on how to size a cluster when you might not have all the details of the workload worked out. In this situation, HyperFlex Profiler is the right approach to learn more about the workloads.
During my time in sales, teams often asked me to size a HyperFlex cluster and provide a customer quote. It was customary to have many more questions than the team or customer could answer about the application. Normally, they would provide me with an Excel sheet with some CPU and memory values. That is a great start, and it gave me deep insight into the customer’s application. However, an application profile is not only about averages of CPU and memory. There are several more parameters needed, including the performance and latency peaks. With the customer’s permission, I would run a HyperFlex Profiler in their environment to gain more information about their application. Before installing the OVA on their vCenter, I would explain what HyperFlex Profiler is and how it helps with sizing their new HyperFlex environment.
HyperFlex Profiler
If there is no historical insight into the potential clustered application environment, then start with HyperFlex Profiler. HyperFlex Profiler will gather data on the vCenter environment and consolidate that mass of data to a single, easily digestible file. This file will quickly size the cluster after importing it into the HyperFlex Sizer tool and paint a clearer picture of the environment and workloads.
However, profiling the environment is not a quick hit in a short period of time. The best approach is to run the HyperFlex Profiler for at least seven days or, preferably, 30 days. A longer measuring period ensures you capture data when “end of the month reports” are run. Of course, don’t just measure the environment during a weekend when there is little traffic! Be sure to capture at least one logical business cycle for that application.
The HyperFlex Profiler is an OVA installed on a VMware environment. The only configuration is to provide (read-only) access to the vCenter environment and define which servers the HyperFlex Profiler will monitor. Multiple servers and/or clusters can be selected. For environments running different types of workloads, it is recommended to isolate them by selecting the servers in their environments – for instance, the VDI or the SQL environment. Of course, selecting all servers and workloads is also an option. Keep in mind that you will have more overhead this way.
When it is monitoring the environment, you will see the following:
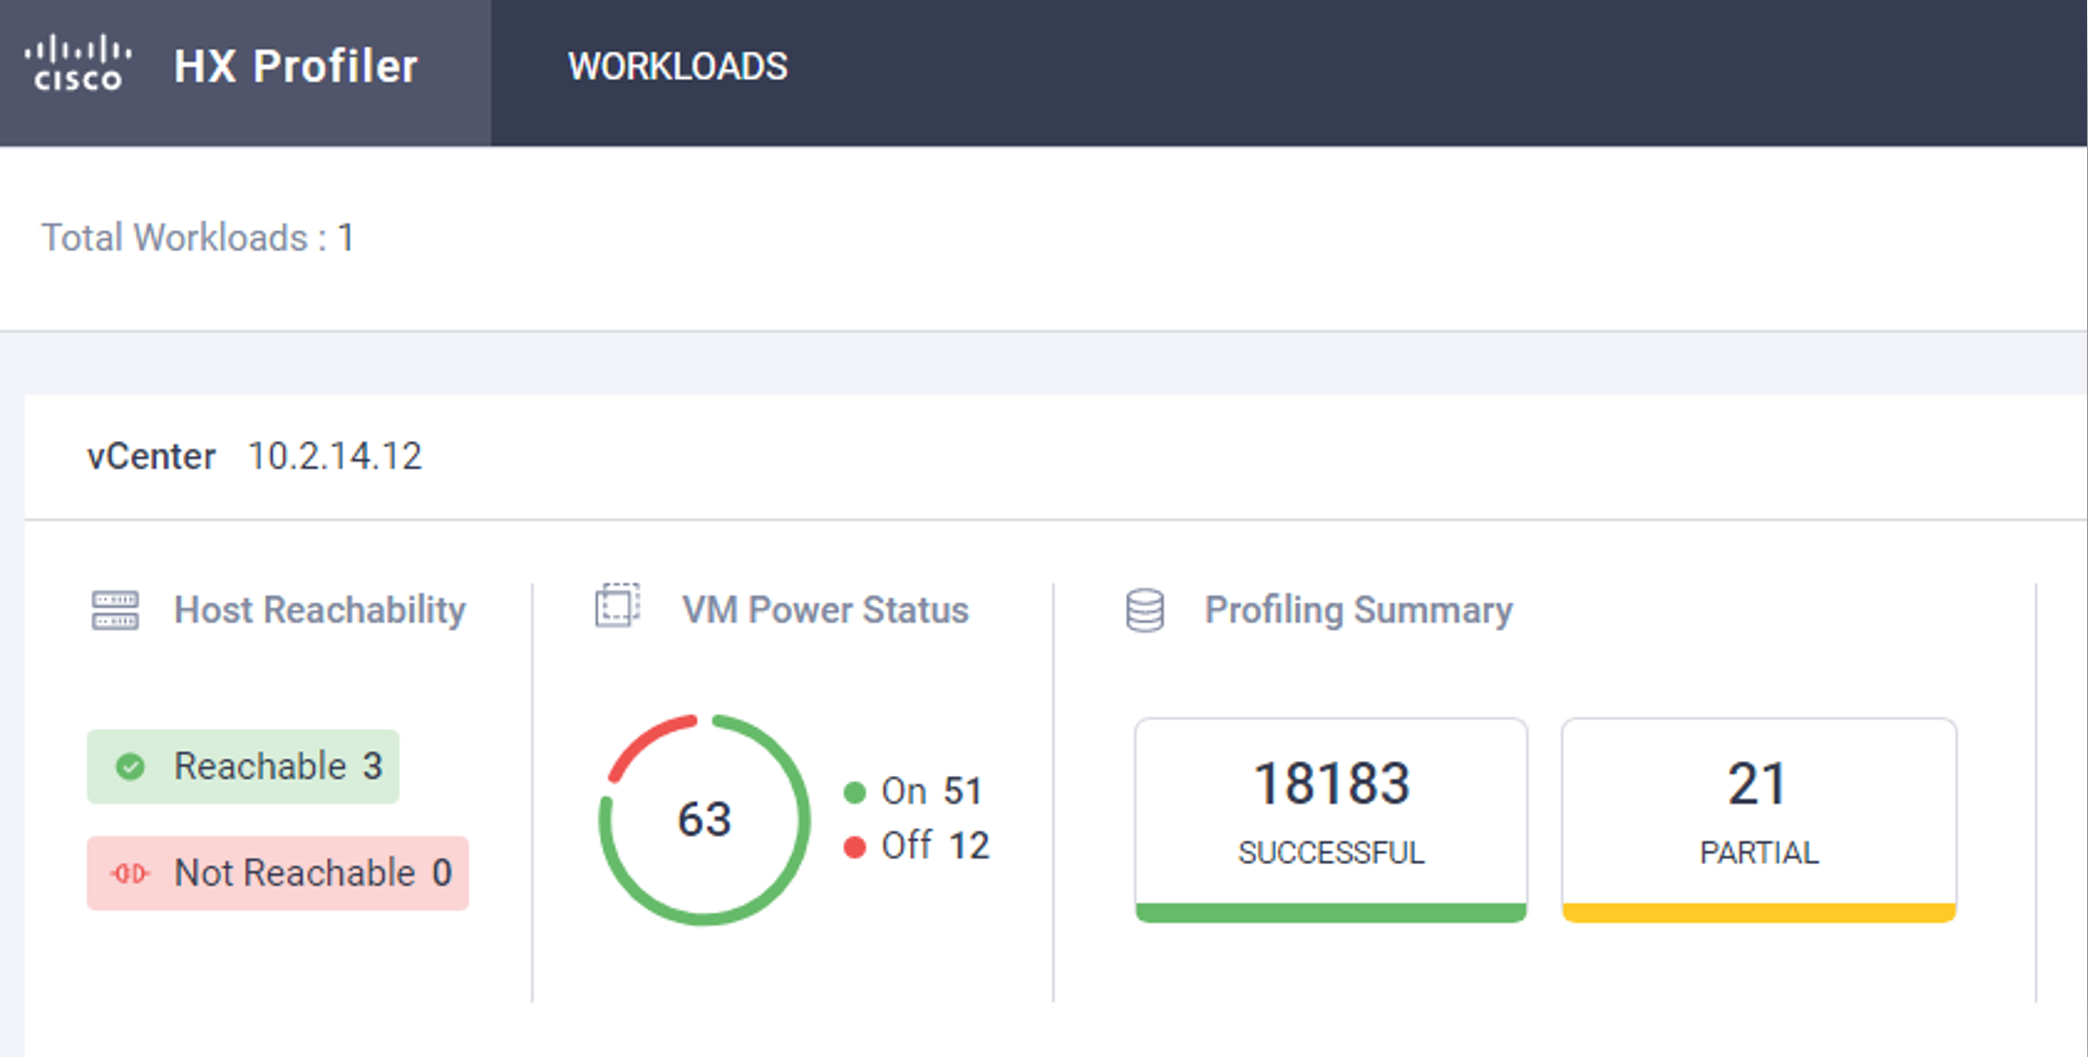
More details about the environment can be shown in other tables and graphics, that can be exported in pdf format.
It is essential to see the peaks of the environment. This way, you can make sure the new HyperFlex designed cluster can handle the workload, and ensure there is room for expansion.

There are different graphs in the HyperFlex Profiler. Here you can see the metrics of the storage reads. Here, you have more insight into the frequently used block-size of the environment. This is one of them:

The next step is to use the power of the HyperFlex ProFiler to create a bill of material out of all the information from vCenter. The data of the HyperFlex Profiler can be manually or automatically downloaded and uploaded to the HyperFlex Sizer.
HyperFlex Sizer
The HyperFlex Sizer is an online tool (https://hyperflexsizer.cloudapps.cisco.com/) accessible to both partners and customers. With this tool, you can add your personal, most commonly used workloads to a HyperFlex cluster and have the sizing tool decide the best option. HyperFlex Sizer takes the HyperFlex best practices into account when calculating the optimal solution.
Furthermore, you can customize the sizing tool, using only the preferred components the customer wishes to see in the new HyperFlex environment. Different elements, like CPU, memory, types and sizes of drives, and more, can be customized.
Uploading the data of the HX Profiler to the HX Sizer is entirely straightforward. After claiming the HX Profile into the HX Sizer, the tool will produce a practical Bill of Materials that can be the baseline of a discussion with your partner about the best solution for your applications.
Here is a screenshot of the HyperFlex Sizer where a HyperFlex cluster is calculated with the requested workload:

A variation of HyperFlex clusters may be advised. This is possible when you want to have different workloads, each with their characteristics.
It shows the amount of HyperFlex or compute nodes, what type of nodes and includes all the parts that are needed to create the solution. This way, you don’t have to configure everything manually, eliminating human errors.
Create an estimate
Once you know the total size of the new HyperFlex cluster, partners or Cisco experts can easily upload the Bill of Material to Cisco Commerce Workspace (CCW) and estimate the HyperFlex cluster.

In CCW, the estimate can be converted to an order.
Summary
Whenever there is little to no information about the workloads that will run on a newly designed HyperFlex cluster, start with the HyperFlex Profiler. Begin gathering data, including critical CPU, a storage profile and memory measurements.
After running the HX Profiler for the recommended minimum of seven days, you can upload the report to the online HyperFlex Sizer tool and start sizing a new HyperFlex cluster with that data. Then, the HyperFlex Sizer creates a useful bill-of-material. After automatically uploading it to CCW, the partner or Cisco teams can make an accurate and efficient estimate of the cluster sizing needs.
Download now to try using the HyperFlex Profiler
to understand your application and size of the new
HyperFlex clusters.


