
One of the things that used to keep me up at night is that troubleshooting a data center network typically involved multiple disparate teams, each having a different view of the network, user interface, and the applications it supports. Historically, it took probing the network manually with complex questions and use the answers derived from custom scripting, spreadsheets, and CLIs for troubleshooting and remediation.
And with scaling into the multi-cloud in modern data center fabrics, the size and scope of deployments are growing into hundreds or even thousands of devices. This results in operational complexity, and the cost of managing these devices has exponentially grown as it takes longer to troubleshoot issues using multiple tools and methods. These multiple tools result in disparate user experiences that result in a lot of time and manual processing spent on troubleshooting and tracking critical network events across global networks. It often requires time to hone into misbehaving devices or collect and analyze data across multiple devices. That can result in downtime which quickly becomes expensive.
Traditional data center network management tools and approaches assume a velocity and volume of change that is well below what is enabled by the cloud and is unable to meet the demands of cloud native applications and digital business.
Cisco Nexus Dashboard is designed to automate, monitor, and analyze your network infrastructure. Innovative architectural approaches were implemented to provide automation and visibility at scale. Nexus Dashboard Insights simplifies operations for our customers with a modern, stateless microservices architecture that can scale horizontally, leveraging open-source infrastructure code. Insights delivers dynamic correlation, impact analysis, proactive alerts, failure prediction, and remediation, along with operational data visualization. These capabilities help consolidate the number of operational tools needed and reduces application downtime, Mean Time to Identify (MTTI), Mean Time to Resolution (MTTR), and the operating costs.
Driving automation and visibility at scale
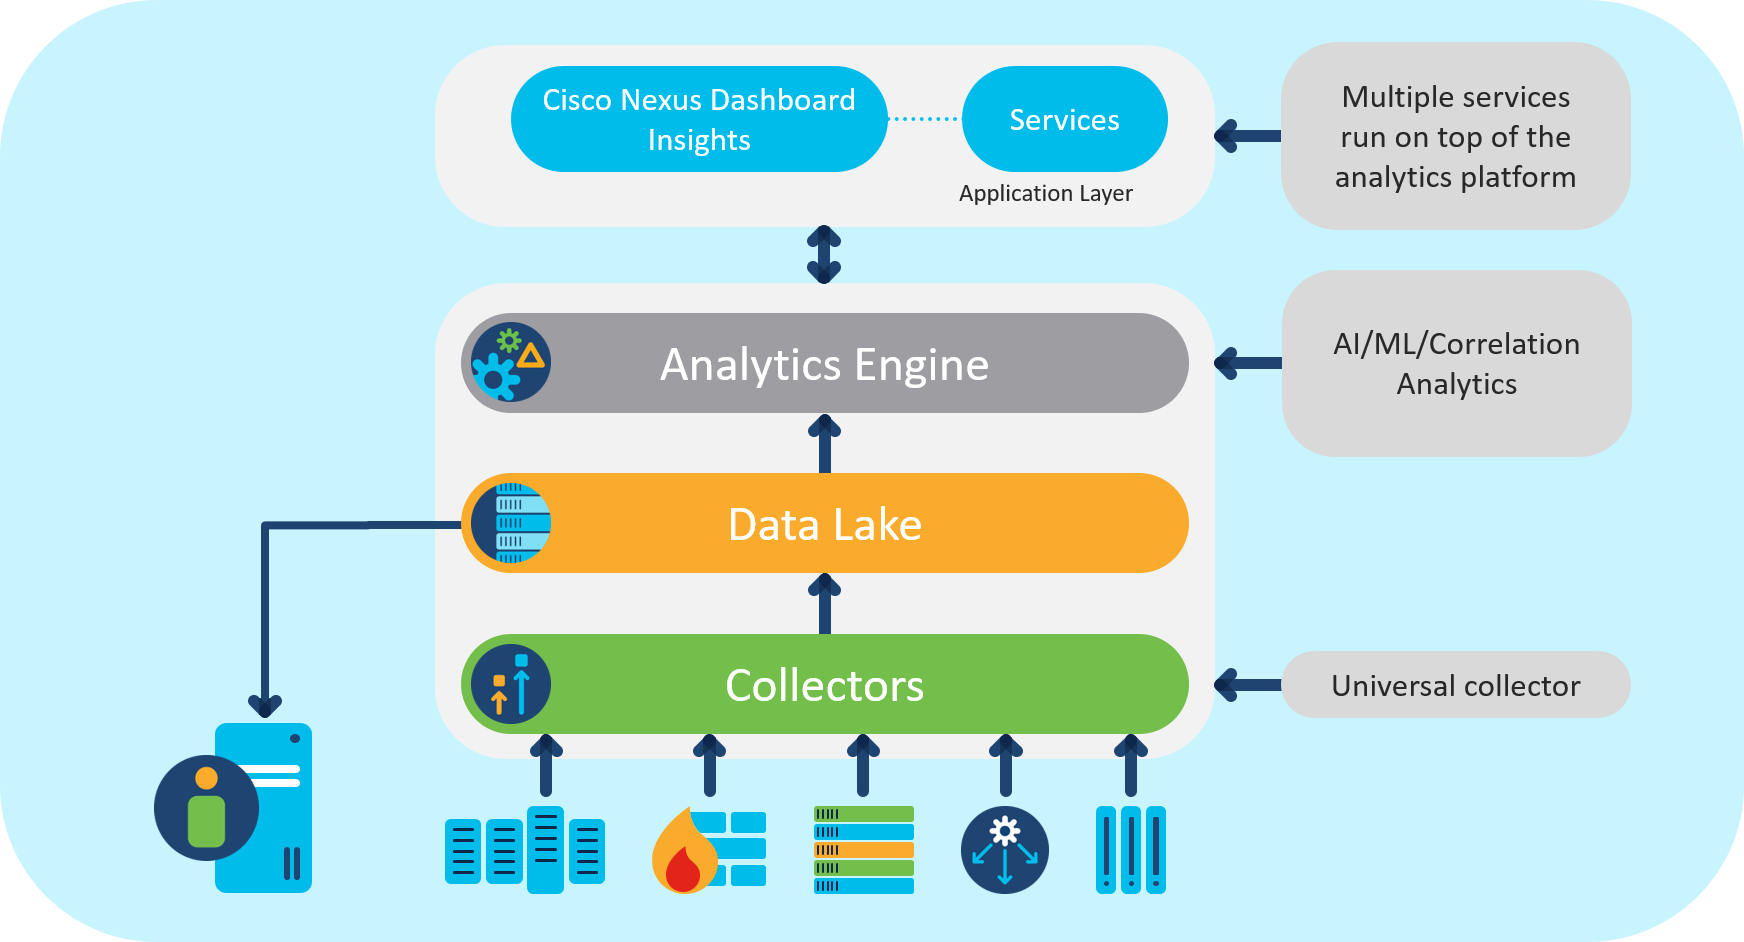
Here are the key architectural components of the Nexus Dashboard Insights architecture:
Collectors: Nexus Dashboard Insights incorporates universal telemetry collectors. These collectors support multiple input plugins for collecting software and hardware telemetry data streamed from networking infrastructure devices like routers, switches, firewalls, and load balancers.
Data lake: Insights pipeline supports data encoded in JSON or GPB, which gets transformed and stored in a data lake for further processing. Telemetry data from legacy devices that do not support streaming telemetry is retrieved using REST API or SSH and then put into the pipeline for transformation.
Analytics Engine: The analytics engine pipeline uses a serverless compute model. It handles tasks such as data enrichment, anomaly detection, data aggregation, and resource scoring by splitting them into modular tasks with associated task specifications. These tasks are processed independently, and the results are saved in the distributed data lake.
Architecture for deep visibility and operational simplicity
Today, we are leveraging best-in-class AI/ML technologies to automate a number of these tasks which were being done manually on CLIs or using custom python scripts. This has led to powerful forecasting and anomaly detection use cases to generate an alert based on analytics of the time-series network data, paving the path towards proactive and predictive capabilities.
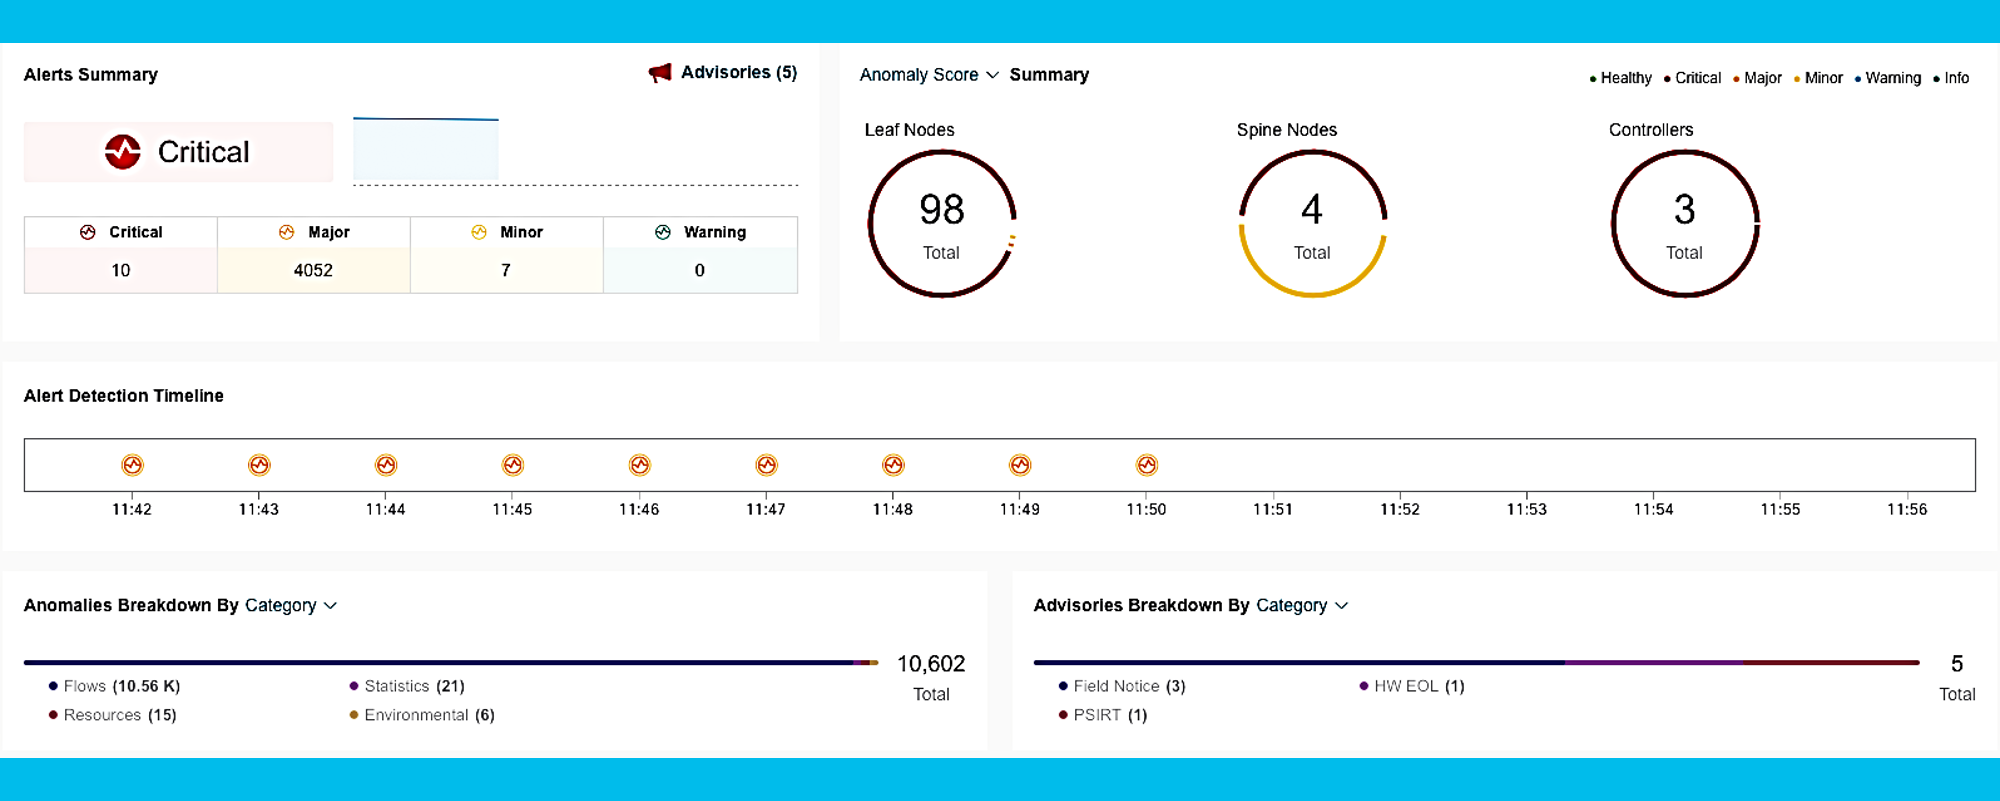
Insights proactively streams software and hardware telemetry from across the fabric. It uses AI/ML technology to create a network-specific baseline for different Key Performance Indicators (KPIs). These baselines are continuously updated to reflect dynamic network behavior. An anomaly alert is generated when the network state crosses the thresholds band set around the baseline. These anomalies can further trigger user-specified actions such as generating email notifications or auto-remediation.
Insights has been built on the principle that beyond identifying a problem in the network, there is a strong need to make the complex monitoring of IT operations simple. We embarked on an automation journey starting with taking additional steps to identify the impact caused by the issue/s and the resulting remediation steps.
We address the architectural demands placed on the modern networks by:
- Hardware and software telemetry: Deep expertise in analyzing hardware and software telemetry: Increases the completeness and accuracy of data that helps monitor, troubleshoot in real-time.
- Future-proof support: Future-proof support for infrastructure devices using capabilities specified in Industrywide supported open standards (both existing and in planning stages)
- Lead with AIOps: Building closed and continuous feedback loop automation into remediation by utilizing AIOps capabilities. Monitor and root cause issues and scale support needs by leveraging a DevOps toolchain to enable development to be very agile resulting in real-time automated pattern discovery.
This allows us to automate and manage legacy data-intensive processes while simultaneously embracing new cloud-driven data frameworks.
Stay tuned to the next set of blogs that will delve into upcoming Nexus Dashboard capabilities and use cases based on this new “built from the ground up” architectural approach.
- One view: With Single Sign-On (SSO) and Role-Based Access Control (RBAC), operate your geographically distributed multi-site environment across multiple Cisco Nexus Dashboard clusters from a single point of control.
- Microburst detection: Insights into network microburst and flows. Expose and locate invisible microbursts, locate congestion hotspots, and protect application performance.
- Anomaly analysis: Solving “Needle in a Timestack” problem for CRC/FCS errors. Compare and contrast time-synced data of multiple parameters to derive a deeper understanding of issues and behaviors.
Resources
Cisco Nexus Dashboard Insights


