
You have probably heard about the old adage “Correlation does not imply causation”. This idea that one cannot deduce a causal relationship between two events merely because they occur in association has a cool latin name: cum hoc ergo propter hoc (“with this, therefore because of this”), which hints at the fact that this adage is even older than you might think.
What most people don’t know is that all the cool deep learning algorithms out there actually fall prey to this fallacy. No matter how fancy they are, these algorithms merely rely on association, but they have no common sense (which can be thought of as some kind of causal model of the world).
In this article, we will explore a few key ideas around the topics of correlation and causality, and more importantly, why you should care about this and how automation can help us in this regard!
Correlation by chance
If you have an interest in data analytics or statistics, you have probably come across the concept of spurious correlations. This term has been coined by the famous statistician Karl Pearson in the late 19th century, but has been recently popularized by the Spurious Correlations website (and book) by Tyler Vigen, which offers many examples such as this one:
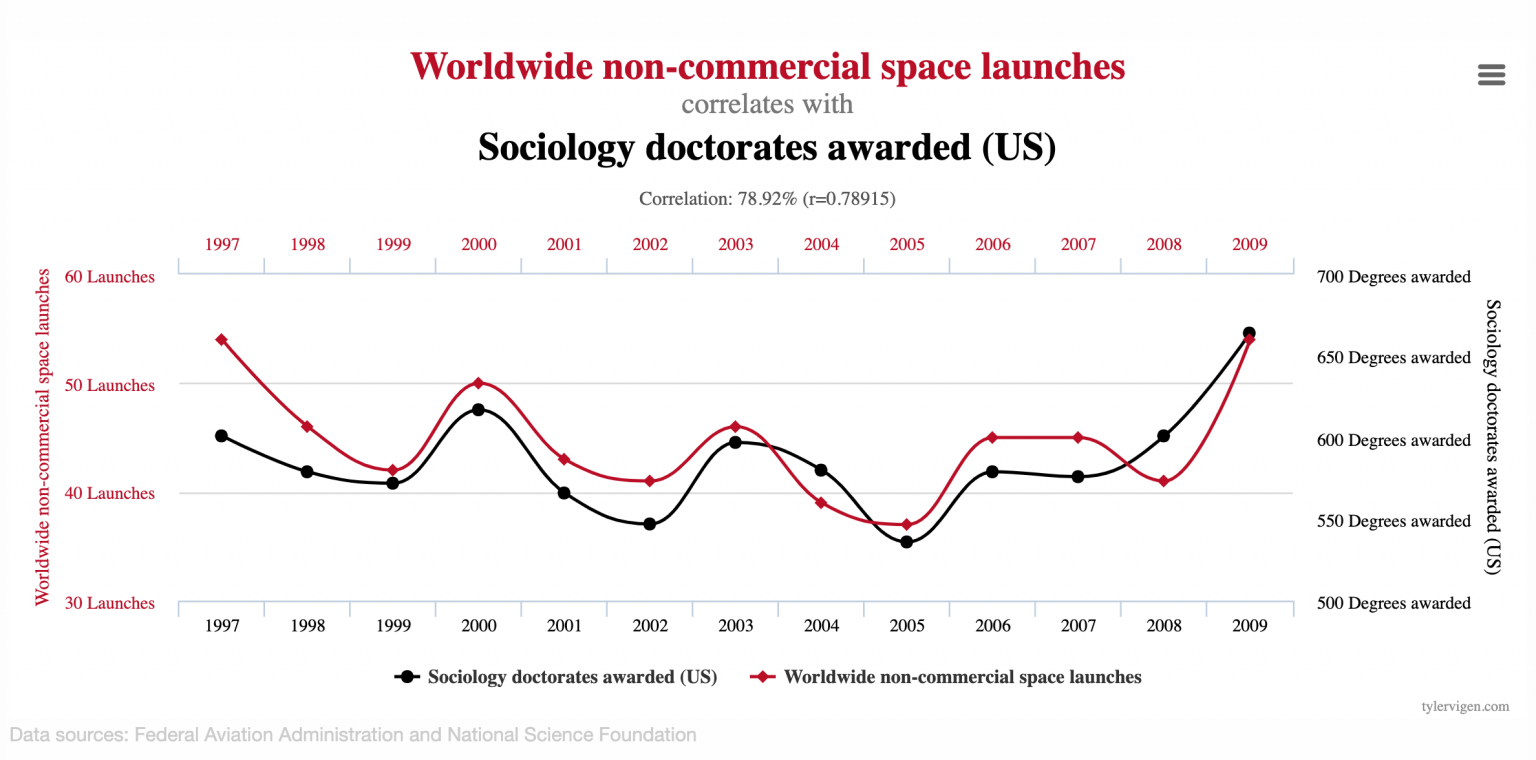
Here we observe that the number of non-commercial space launches in the world happens to match almost perfectly the number of sociology doctorates awarded in the US every year (in terms of relative variation, not in absolute value). These examples are of course meant as jokes, and this makes us laugh because it goes against common sense. There isn’t any connection between space launches and sociology doctorates, so it is pretty clear that something is wrong here.
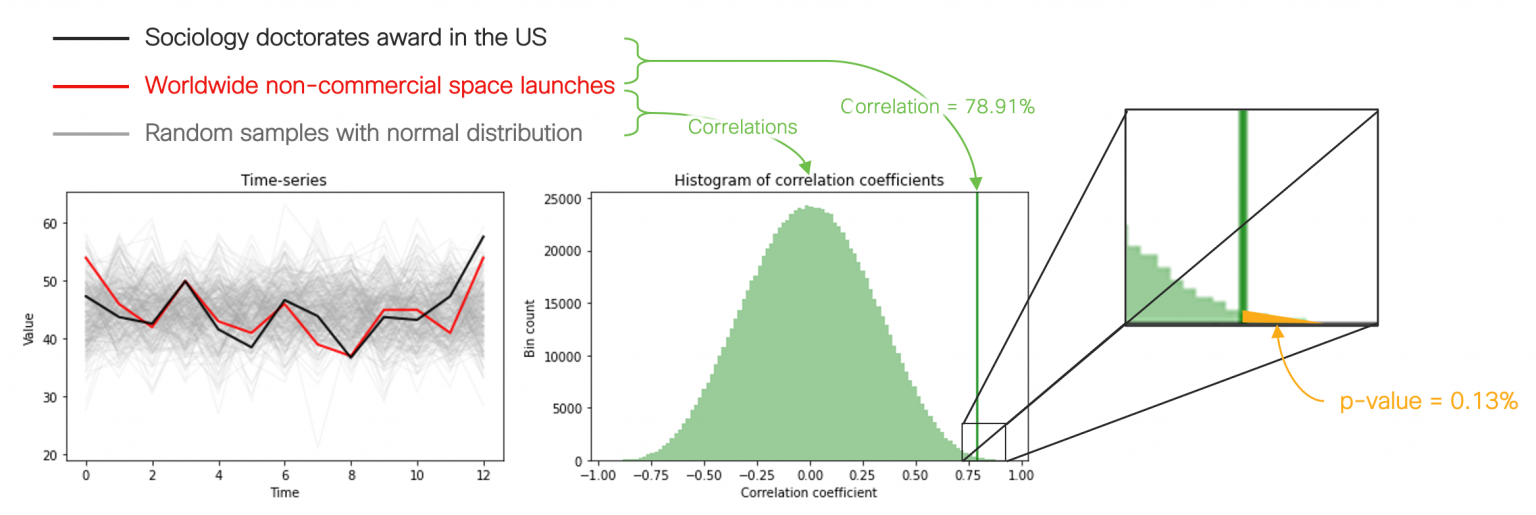
Now, examples such as this one are not exactly what Karl Pearson had in mind when he coined the term, because they are the result of chance rather than a common cause. Instead, we are dealing with a problem of statistical significance: although the correlation coefficient is nearly 79%, this is based only on 13 data points for each series, which makes the possibility of correlation by chance very real. Actually, statisticians have designed tools to compute the probability that two completely independent processes (such as space launches and sociology doctorates) produce data that have a correlation at least as extreme as a given value: statistical testing (in which case this probability is called a p-value).
I applied a statistical test for the above example (see this notebook if you want to test it yourself and see other examples), and I obtained a p-value of 0.13%. I also tested this result empirically by generating one million random time-series and counting how many such time-series had a correlation with the number of worldwide non-commercial space launches higher than 78.9%. No surprises here, I get roughly 0.13% of my trials falling in that category. This summarized in this figure:
 One important lesson here is: by searching long enough in a large dataset, you will always find some examples of nicely correlated examples. By no means you should conclude that there is some actual relation between them, let alone some causation!
Correlation due to common causes
Now, you can be in a situation where not only the correlation is high, but the sample count is also high, and statistical testing will be of no help (that is, in the above example, you would never be able to generate a random time-series more correlated than your real data). Yet, you cannot conclude that you are in presence of a real situation of causation!
To illustrate this fact vividly, consider the following (made up) example featuring two processes: process A generates a time-series and process B generates discrete events. A realization of these processes is shown below:![]()
![]()
![]()
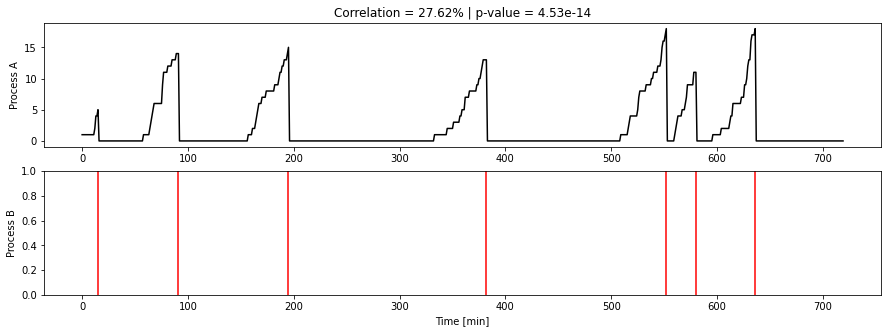 We observe a systematic build up of time-series A, followed by an event B. For the sake of the illustration, let us assume that we have a very large dataset of such time-series and event data, and they all look pretty much like my diagram. The above example has a correlation of 27.62% and an infinitesimal p-value, which rules out correlation by chance. The build up of A happens prior to the event B, so it seems clear that it is a cause of B, right?
But what if I told you that A represents the number of people observed on a platform in a train station and that B corresponds to the arrival of a train on this platform? Then it all makes sense of course. Passengers accumulate on the platform, the train arrives, and most passengers hop on the train. Does that mean that the passengers cause the train to arrive? Of course not! These processes do not cause each other, but they share a common cause: the timetable!
The next post in this series will explore why you should care about spurious correlations when dealing with networking telemetry, how modern AI fall prey to those, and why automation is key in tackling these limitations.
Want to receive Analytics & Automation blogs in your inbox?
Subscribe here!


Good one Gregory and looking forward to your next one!
I recently came across an interesting correlation and causation scenario.
Every time the dad and daughter went to eat an ice cream in that store, the car would not start. Is there a correlation? And is there a causation? 🙂