As for the last 11 years Cisco sponsored the FOSDEM 2020 conference in Brussels. This is one of the largest, if not the largest, open source conference in the world with this year 872 events spread over 2 days.
From a network point of view the important part is that the main SSID at the conference is IPv6-only, using NAT64 and DNS64 to provide access to IPv4-only resources on the internet. For users which require IPv4 connectivity a ‘legacy’ dual stack network is also available. The name of this SSID is changed yearly so that people consider moving to the IPv6-only network.
As in the last few years we provided and configured the switches and the ASR 1006 router, where we use the netflow and NBAR features to collect the HTTP user agents field the router sees. These user agents are sent by the clients to web servers in clear text and can tell us something about the application, client operating system or architecture. We then analyse this data to see trends.
Unique MAC addresses == number of clients
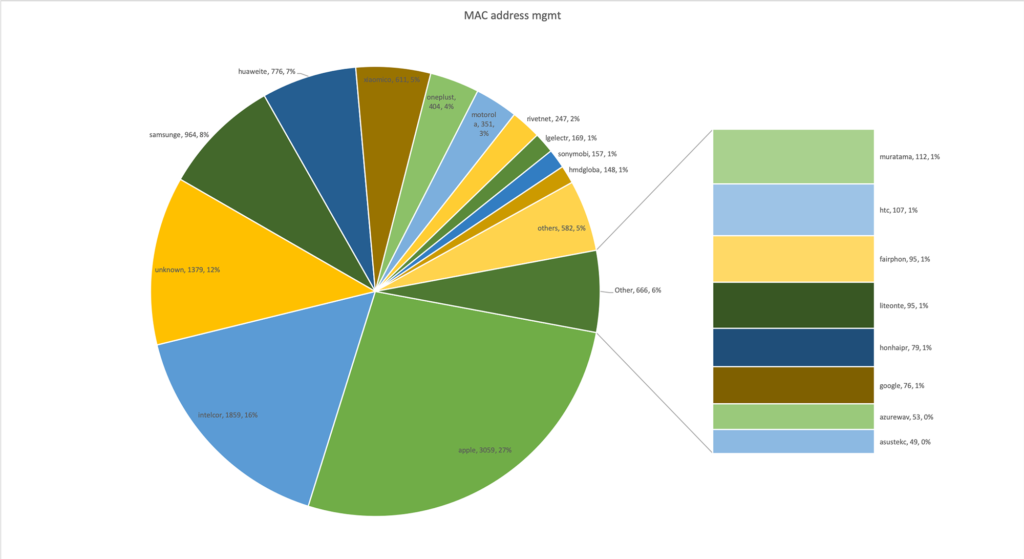
Last year (our report of 2019) we faced the problem that we saw a lot of artificial MAC addresses on the network, in total we saw 129,959 unique MAC addresses last year. This year we enforced the usage of DHCP on the IPv4 network, strengthened the security and fixed a few bugs and added more checks in or reporting tools. If this worked is unclear, however this year we ‘only’ saw 11,372 unique MAC addresses, of which 9,993 could be attributed to a known manufacturer and 1,379 seem randomized. Of these we could guess the operating system used for 1,007, all of which were running Android 10 on diverse platforms.
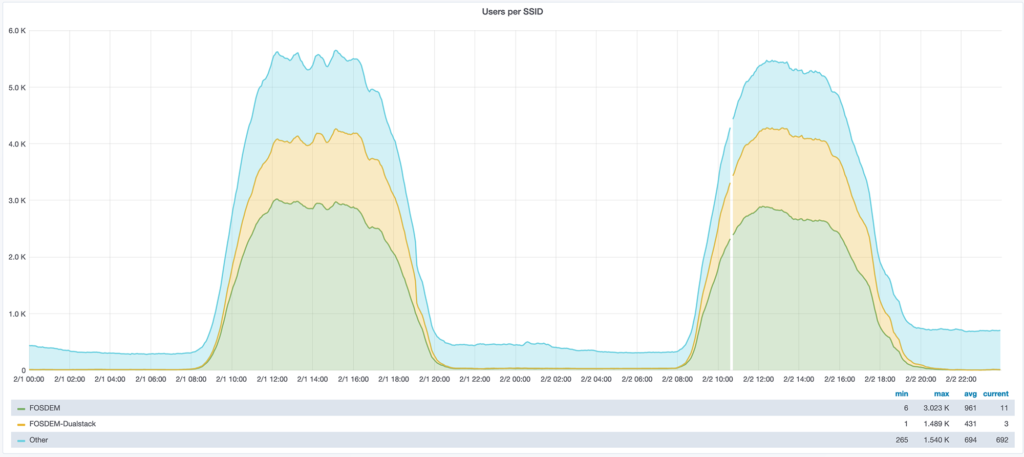
Last year we could attribute 11,781 unique addresses, so we are seeing a reduction in the number of clients. This seems to be confirmed by the statistics gathered by the wireless controller, which saw about 6,000 concurrent users in 2019 and about 5,500 in 2020. We assume that more people simply use roaming as for EU guests this is almost always included in their package.
More Bandwidth used by fewer clients
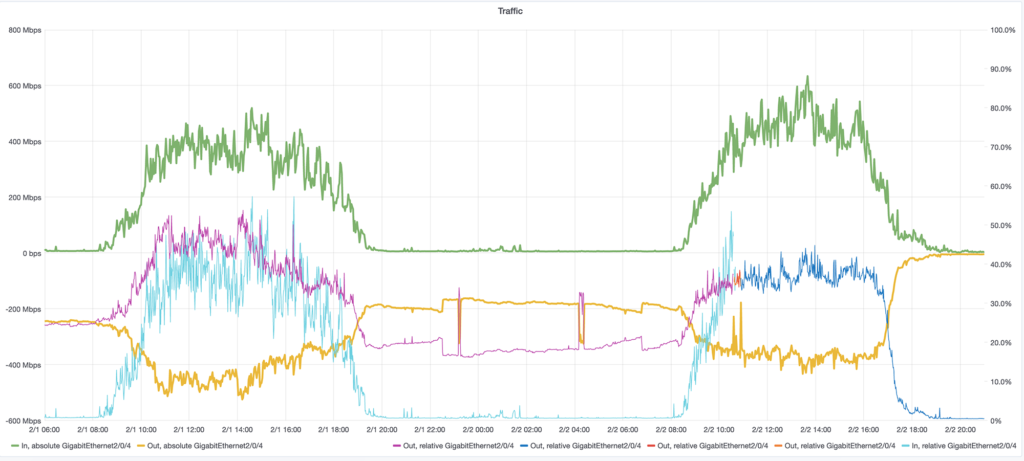
However, these fewer users did consume more bandwidth. Far more bandwidth, input from the internet went from last years 2,960,975,295,300 bytes to 23,658,552,410,903 bytes, a growth of 799%. Also output towards the internet went from 1,755,298,210,796 bytes to 12,715,921,100,135 bytes, a growth of only 724%. Our uplink was almost constantly loaded during the whole event.
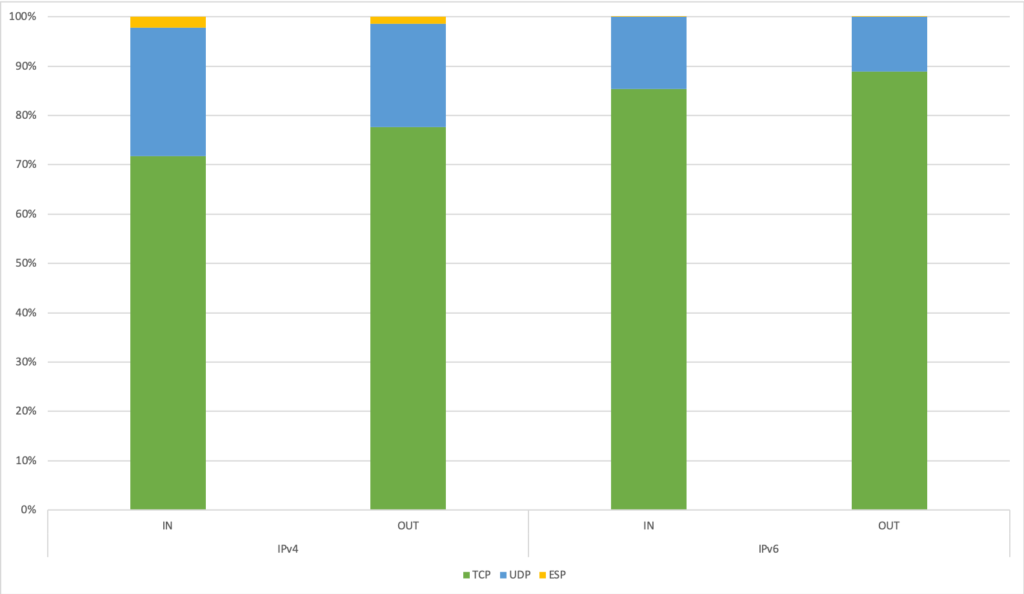
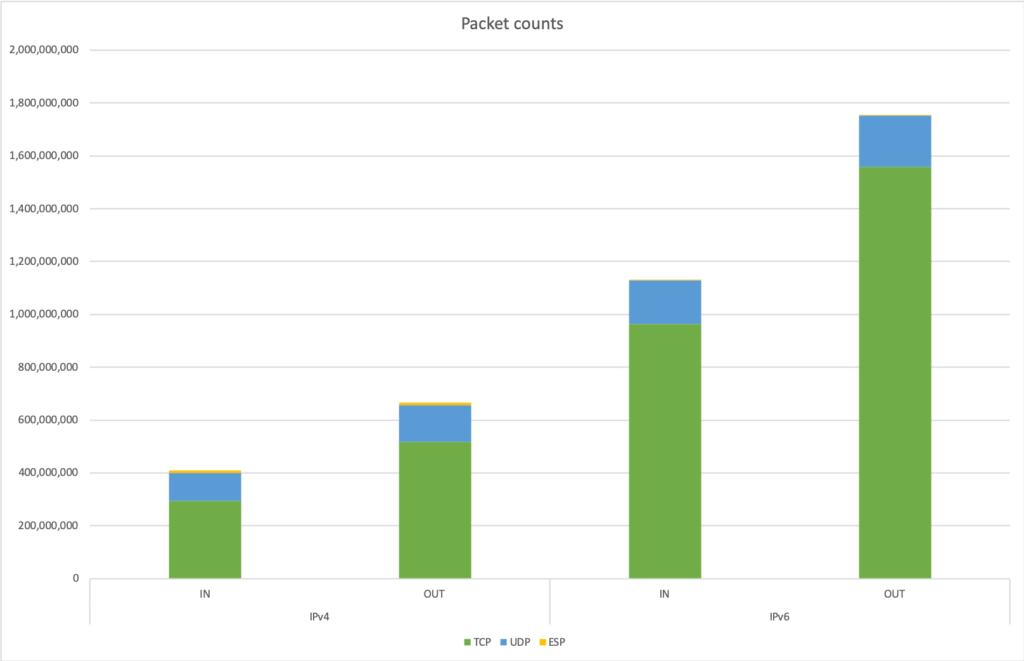
We also checked the distribution between the IPv4 and IPv6 traffic and the IPv6 traffic largely trumps the IPv4 traffic, just as it did last year.
When checking the makeup of traffic, we can see the ESP traffic only contributes on the IPv4 network:
NAT64
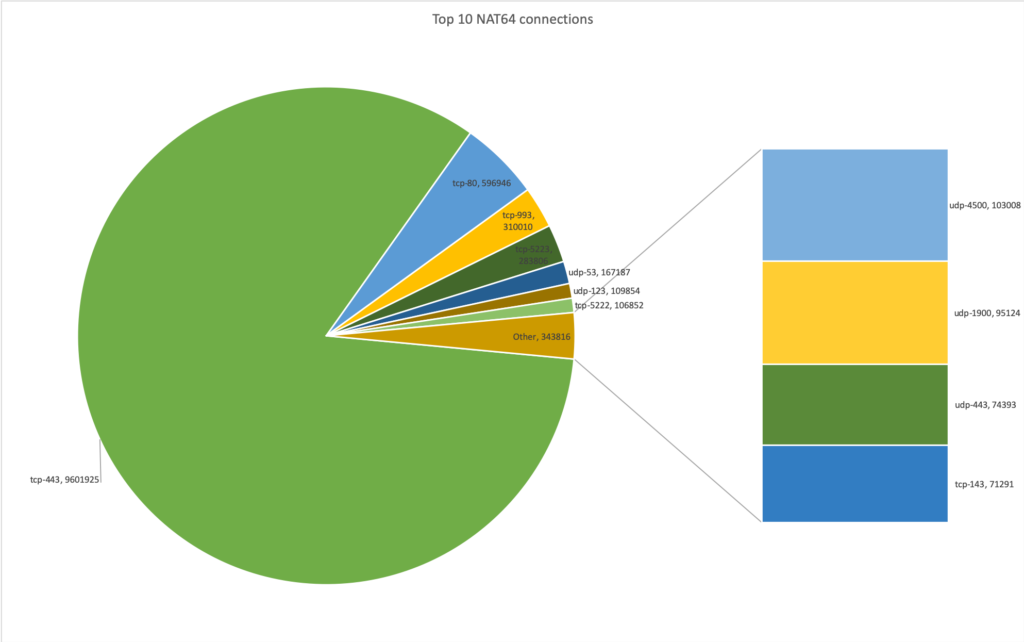
Of the 8,233 clients whch were on the IPv6-only network at one time, 7,854 or ~95% used the NAT64 feature. We had 7,462 connections which were not using ICMP, UDP or TCP, 109,553 ICMP, 722,511 UDP and 11,496,472 TCP connections over NAT64. Below are the top 10 services carried by NAT64:
As to the destinations it is more complicated. We only see the IP’s and when trying to identify them it’s difficult. In one case there is even a mystery: we see a multicast IP (!). The top 10 destinations handled by NAT64 were:
| flows | Destination |
| 51917 | tcp-151.101.37.140:443 |
| 52771 | tcp-17.57.12.11:443 |
| 53745 | tcp-104.244.42.194:443 |
| 58154 | tcp-104.244.42.130:443 |
| 62405 | tcp-162.125.19.131:443 |
| 78394 | tcp-104.244.42.2:443 |
| 87108 | udp-239.255.255.250:1900 |
| 107926 | tcp-17.130.2.46:443 |
| 135796 | tcp-13.225.17.152:443 |
| 196920 | tcp-151.101.36.133:443 |
What can we tell about the clients?
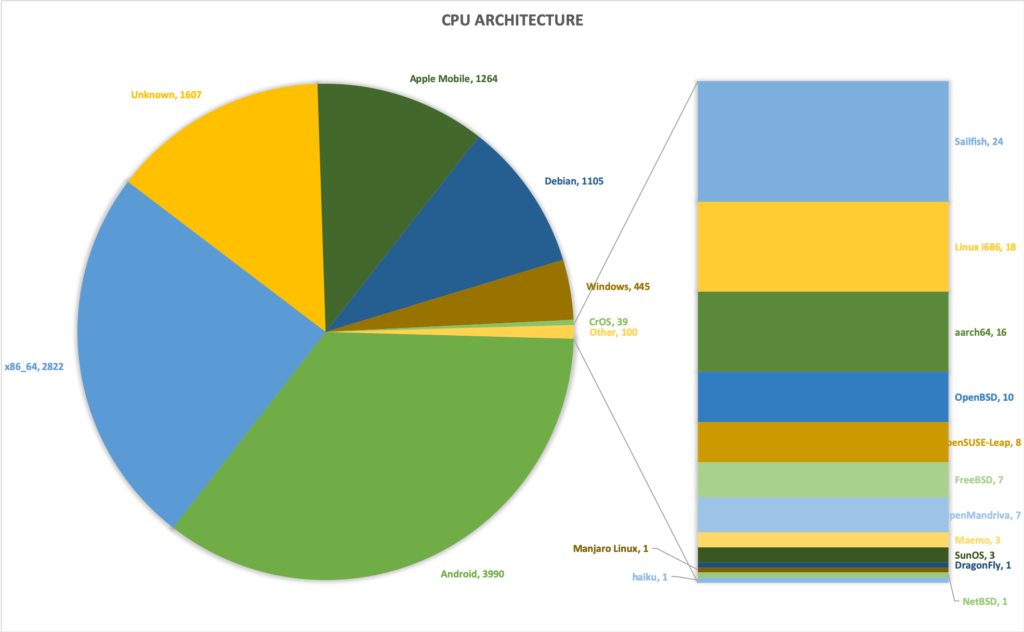
Some devices send the architecture of the CPU, which we can use to collect statistics. Android and Apple Mobile devices in general are ARM based.
When we analyse the MAC addresses we can identify the manufacturer of the device, based on the ‘manuf’ list from the Wireshark sources. This gives the following distribution:
We can try to guess the operating system running on the device, based on the HTTP user agent string. This is not only difficult as some user agents are schizophrenic (what browser is “Mozilla/5.0 (Linux; Android 9; MI 8 Build/PKQ1.180729.001; wv) AppleWebKit/537.36 (KHTML, like Gecko) Version/4.0 Chrome/67.0.3396.87 XWEB/1163 MMWEBSDK/191102 Mobile Safari/537.36 MMWEBID/6033 MicroMessenger/7.0.9.1560(0x2700096B) Process/toolsmp NetType/WIFI Language/en ABI/arm64“, and doesn’t it leak way too much information?) but some devices emit only very generic useragents like “ConnMan/1.32+git97.3 wispr”.
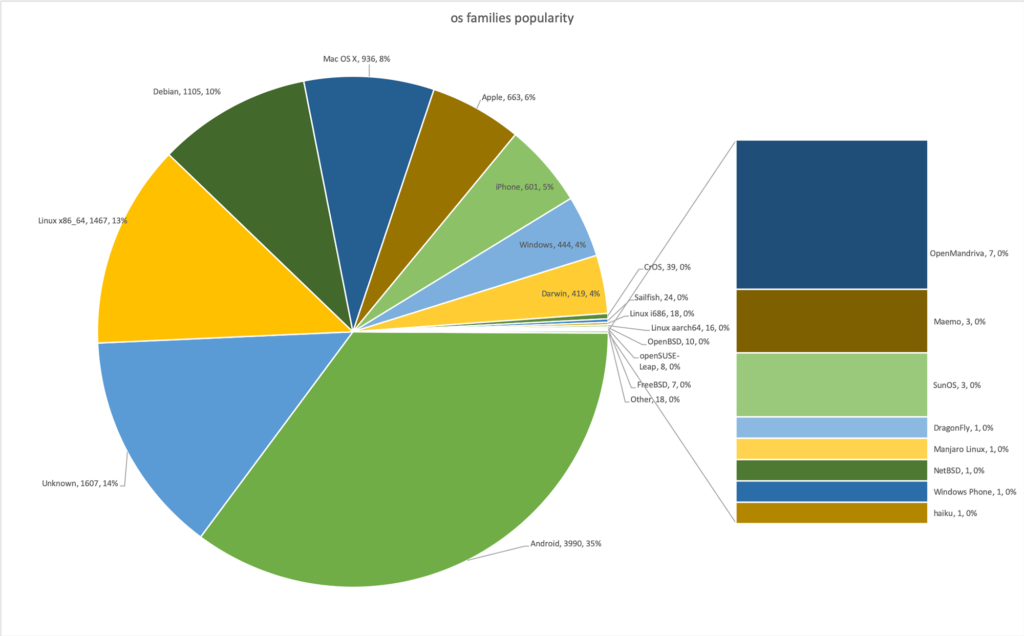
So, we manually try to detect the operating systems and architectures used, which means that for some we can only detect it is a Linux running on x86_64, while for others we can only say it is some kind of Apple device. We get the following results:
On which networks do we find the clients?
The rise of IPv6 continues. Like last year we had ~3460 IPv4 DHCP on the legacy network, but we had 6235 clients which stayed on the IPv6 only network and did not go back to the legacy network. 1,998 clients were seen on both the legacy and the IPv6 only network and 2,561 clients never even tried the IPv6 only network. We can identify which clients were on the different networks:
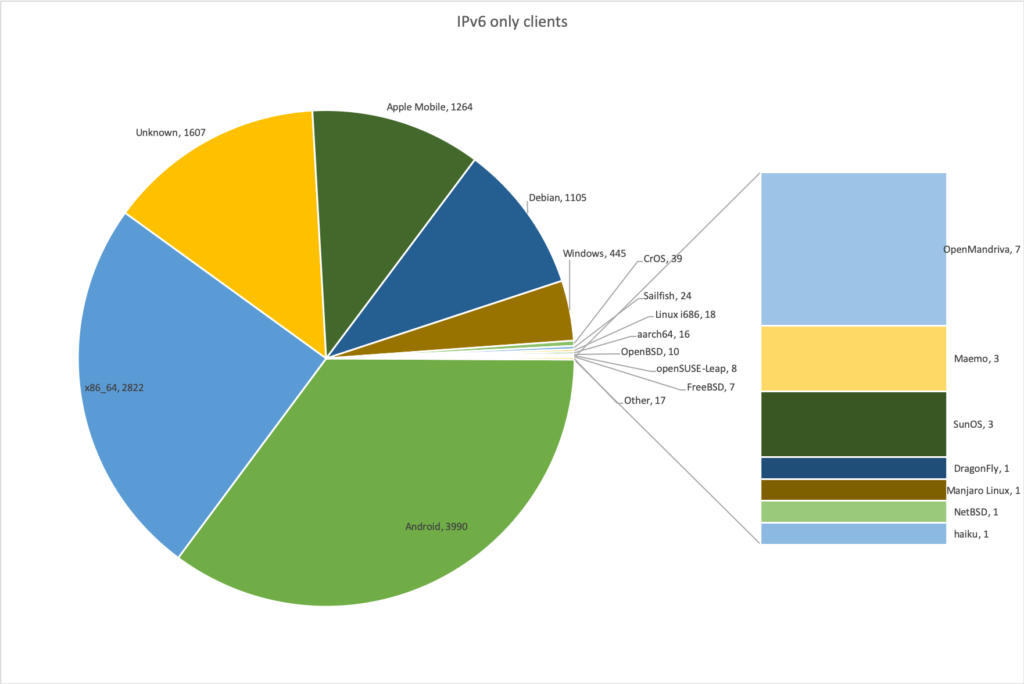
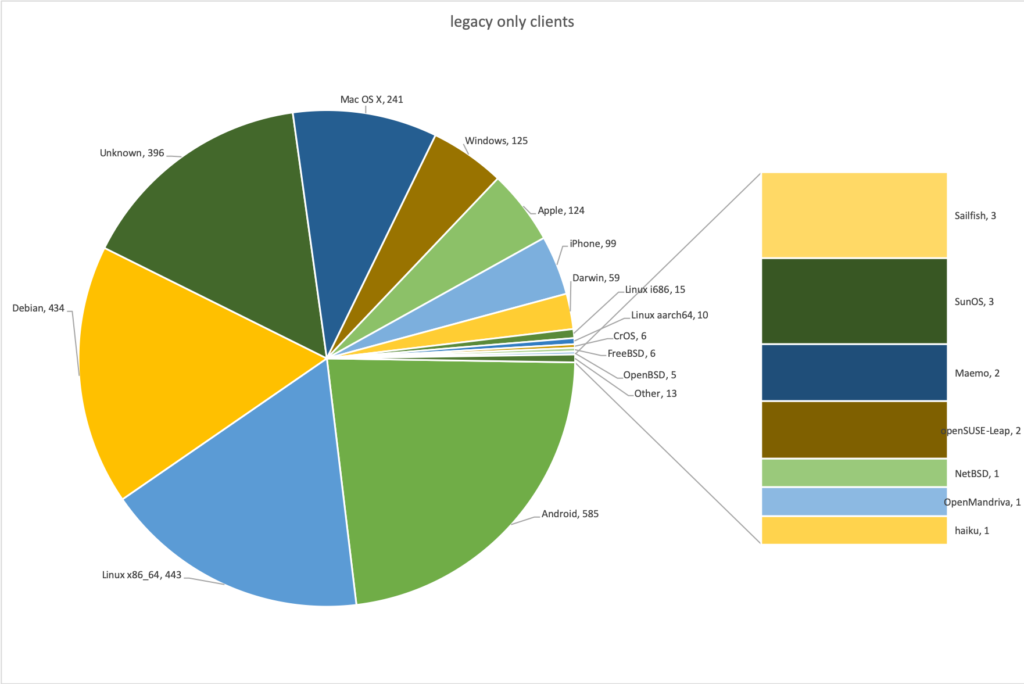
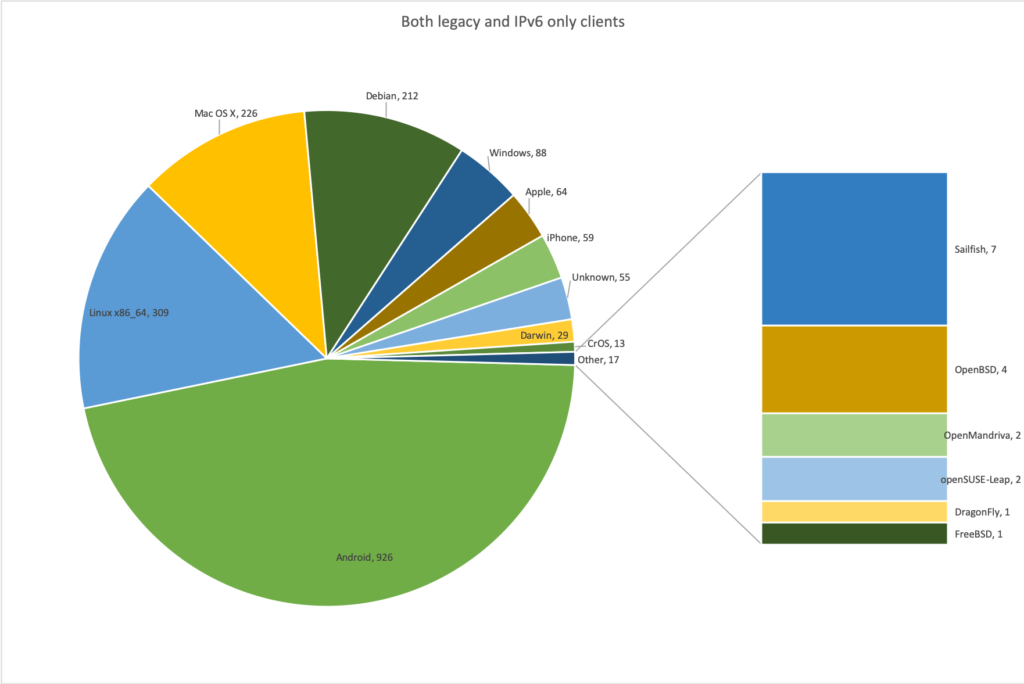
Everybody’s favourite client: The Windows Phone, was on the IPv6 only network, counted as part of the ‘Windows’ family.
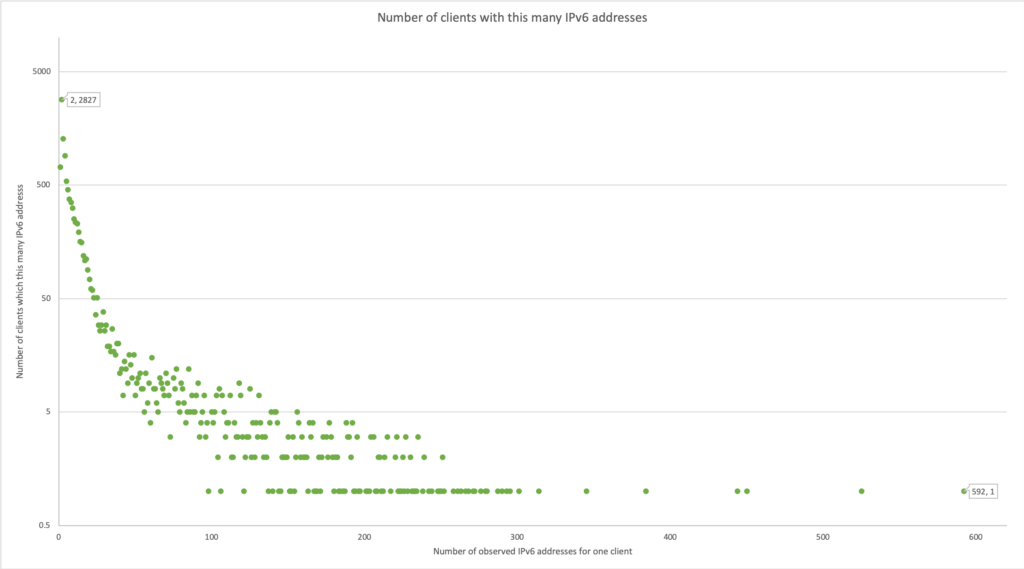
Eating addresses like candy?
Some devices rotate through the IPv6 addresses at a high rate, we found a few which used more then 400 IPv6 addresses over the course of the weekend. All of those clients are in fact iPhone 13.3 devices and not some more ‘hacker’ device. Most devices only use a few, and the majority only two: the link-local and the global IP.
What can we say about the traffic?
We continue to see the majority of VPN based ESP traffic on the dual stack legacy network. Again, we used NBAR2 to classify the traffic giving the following results:
asr1k#show ip nbar protocol-discovery interface gi2/0/4  stats byte-count top-n 20
...

Input                    Output
                              -----                    ------
 Protocol                     Byte Count               Byte Count
 ---------------------------- ------------------------ ------------------------
 shoutcast                    47029363893              2112934159987
 ssl                          969293704522             608105734792
 statistical-p2p              52012656918              1110991906422
 unknown                      283397102118             529552327874
 http                         85483662261              713775820214
 google-services              266502623472             147675163463
 proxy-server                 6012538536               333564857312
 binary-over-http             116312457935             1770591381
 amazon-web-services          74296965211              32039361466
 twitter                      68570673404              8287476941
 facebook                     67610858696              7142510259
 akamai                       60348002605              4396237959
 netflix                      56448209276              2820631545
 apple-updates                57130900493              1120491337
 youtube                      55489033038              1850317608
 github                       52301021133              2322815054
 openvpn                      42285183215              8426470948
 instagram                    47000986713              3638936268
 icloud                       20648621225              29671510399
 conference-server            4028241437               43888642924
 Total                        2432202806101            5703975964153
The high amount of traffic for shoutcast is probably the people in the corridor streaming the talk inside of the room they could not enter. It is strange that we have more netflix then github traffic, but as someone told me: “byte for byte github content takes a lot more time to properly enjoy”. We can also check which traffic caused the highest bit rate:
asr1k#show ip nbar protocol-discovery interface gi2/0/4 stats max-bit-rate
...
                             Input                    Output
                              -----                    ------
 Protocol                     30sec Max Bit Rate (bps) 30sec Max Bit Rate (bps)
 ---------------------------- ------------------------ ------------------------
 ssl                          353356000                322821000
 ms-services                  443143000                10610000
 ssh                          42297000                 297418000
 google-services              151221000                91569000
 statistical-p2p              63718000                 162086000
 amazon-web-services          101362000                93969000
 http                         67107000                 114832000
 unknown                      90678000                 85028000
 shoutcast                    10624000                 156234000
 binary-over-http             151637000                2102000
 apple-updates                139678000                3757000
 isakmp                       61012000                 69309000
 ipsec                        66291000                 62469000
 netflix                      76857000                 44271000
 github                       101191000                3399000
 icloud                       65720000                 36435000
 adobe-services               58527000                 43031000
 openvpn                      58213000                 34107000
 youtube                      89154000                 1589000
 statistical-conf-audio       45154000                 44640000
 crashplan                    38509000                 48593000
 proxy-server                 1423000                  83464000
 bittorrent                   51471000                 32060000
 akamai                       75391000                 5746000
 google-downloads             75773000                 2096000
 dropbox                      61787000                 14648000
 http-alt                     44900000                 28934000
 statistical-conf-video       11006000                 61704000
 ms-update                    65564000                 1084000
 ms-office-365                31290000                 33657000
 Total                        2694054000               1991662000
I think only at FOSDEM the third highest protocol in maximum bitrate can be ssh at 2,97,418,000 bps of outgoing traffic. That’s ~35.5 megabytes per second of outgoing traffic.
Looking towards the future:
Next year we will try:
- To get multiple inter-building links. We are reaching limits here and this would help for redundancy.
- To get a second uplink, again we are coming close to the limits of our 1Gbps uplink here.
- To disable 2.4GHz on the main SSID and add extra AP’s to fix coverage holes. This should help with high density situations like in Janson.


Thanks for the report, quite interesting data.