
We have all heard the idiom that a picture is worth a thousand words, but I think we can also say that when it comes to the amount of data we collect a picture is often worth pages and pages of data. We are also watching the emergence of VR (Virtual Reality) being integrated into more and more applications across our lives from video games, to medical treatment and various aspects of managing technology.
Troubleshooting wireless issues and heatmaps in the past was very time consuming and had some limitations due to several factors such as
- 2D representation
- Lack of granularity to account for details of construction and building materials
- Inability to view heat map at specific elevation (i.e. 3’ above floor – table height)
- Heatmap data was based on data collected from the Access Points and Controller and was somewhat of an estimation model.
Today we live in a whole different reality. For one in many environments and with digital transformation projects wireless is the network and the level of expectations from the wireless networks is much higher with far more visibility. This puts a different level of expectations on the wireless network engineers and makes the job very demanding. As the good old saying goes that necessity is the mother of invention. Cisco has responded to the demand with the addition of the 3D heat maps to DNA-Center’s wireless assurance.
Previous 2D representation of heat-map is below

Here is the same floor with a 3D representation of the heat-map

With 3D representation, note that the image above shows the ability to compute APs from adjacent floors.

After checking the boxes to compute APs from adjacent floors, look at how the heatmap now shows computed RF based on adject floors.
Some of the new features and advancements in DNA-Center release 2.3 include:
- 3D heatmaps provide visibility into the 3D world we live in instead of the previous 2D overlay.
- Ability to assess heatmap at a specific elevation from the floor or ceiling. For example in a conference room, it is important to assess signal strength at table high ~3’ as that is where it counts. In a warehouse where access points are often at 20’ to 30’, heapmaps are needed at “human elevations”.
- Ability to walk through the building layout in a VR 3D environment and see obstacles and the heatmap/ RF telemetry in a specific location.
- Integration of data from the AIR-1800S sensors provides a true client perspective with the ability to assess RF telemetry for several access points.
- Ability to add furniture, glass windows, whiteboards, and objects that could impact the RF signal with the ability of the model to assess impact of objects on the RF
- Integration of adjacent floors from above and below as sometimes the closest access point might be above or below.
-
Ability to import maps from an autocad file which enables precise wall locations, beams and scale. Just getting maps and images to accurate scale was a time staking process.
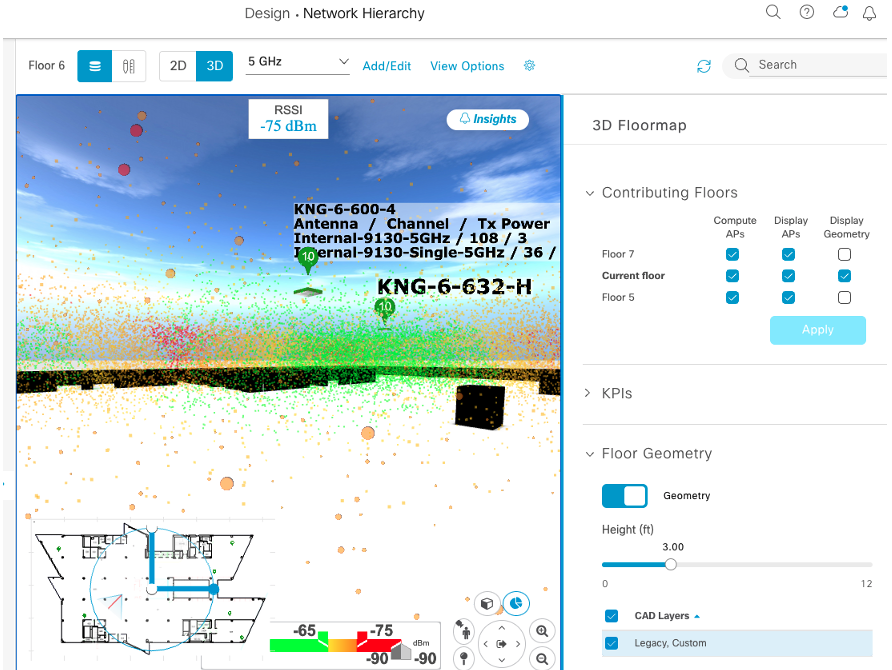
Note with the image above, that now you are able to virtually walk through the space, and see the RSSI at the location you are at. You can also see from this example that as you get closer to the floor, the lower RSSI zone is actually an upside down triangle which is often not visible from the 2D maps.
One of the use cases for robust design is the ability to stand in the 3D model, disable an access point and observe the impact and coverage hole. This is very handy in building a proper overlap.
An Additional use case is to support the notion that in some situations less is more and this tool can also be used to ensure we don’t over saturate an area with access points which can make things worse. The ability to see impact and RF propagation from adjacent floors is a game changer.
My last use case which is often overlooked is the fact that conference rooms and meeting rooms are often a VERY high visibility room. Being able to see the RF heat map in the room taking in account RF interference from windows, glass whiteboards, etc can help ensure that we can deliver flawless service into those environments.
Putting all these features together is a huge uplift to the already amazing network assurance functionality found in DNA-Center saving time in troubleshooting and helping deliver the level of service businesses expect from today’s enterprise wireless networks.
I can’t imagine operating an enterprise wireless network without Cisco DNA Center and its Wireless 3D Analyzer.
Read Cisco’s Wireless 3D Analyzer introduction blog to learn more
Cisco Wireless 3D Analyzer: A game changer in simplifying WiFi planning, monitoring, and troubleshooting


Great customer feedback on Cisco Wireless 3D analyzer!