
What is OpenTelemetry and why does it matter?
Estimated read time: 8 min
Modern IT systems are designed for agility, flexibility and scale. They’re multi-environment, services-based, and adaptable for the rapidly changing demands of technology and business. They’re also more complex, dynamic, and loosely connected than the monolithic systems they’ve replaced. Given the distributed and shifting nature of these systems and all their moving parts, it’s getting harder to oversee and manage them without the right observability tools in place.
OpenTelemetry (OTel) has emerged as a valuable framework for collecting performance data from every potentially observable component within a system, at every layer of the IT stack. Conceived from two Cloud Native Computing Foundation incubator projects to create high-quality, built-in telemetry, OTel offers a vendor-agnostic, open-source standard for data collection in a market of bespoke commercial tools and narrow open-source monitoring solutions.
Why does OpenTelemetry matter?
Systems need instrumentation in order to observe them. This instrumentation, or telemetry, tracks the behavior of components – be they servers, networks, applications, or interfaces – within your environments and reports back to analysis tools to support troubleshooting and system fine-tuning. If the incoming data is incomplete or hard to collate, then it is nearly impossible to understand process interdependencies and the overall functioning of your system.
Until OTel, organizations relied on a hodgepodge of instrumentation tools and libraries, often installed in a patchwork across the enterprise. Because data conventions were different across different tools and teams, it was hard to marry the information or arrive at a common understanding of performance across environments.
OTel collects, collates, and delivers telemetry data in a consistent, and flexible, way, no matter where you’re instrumenting your systems. It works with many common programming languages and is configurable for integration with other codebases. It also works with multiple backends, which eliminates the need to install and manage multiple proprietary agents to get data. Importantly, it propagates context across systems and signals, which is critical for understanding data at scale and for flexibility as data standards evolve.
Industry is adopting OTel because of this standardized, adaptable approach, which makes it easier to instrument components in constantly evolving environments and to tailor observability strategies to future system needs. By taking unnecessary complexity out of telemetry, OTel helps users focus less on data collection and more on how to apply information to improve service quality.
What’s in OpenTelemetry?
To explain the parts of OTel, it’s helpful to first separate it from what it isn’t. OTel is not an observability backend that organizations use to analyze their data and prescribe service interventions. Instead, it’s a set of tools for collecting and normalizing data for export into those backend observability solutions.
OTel generates metrics, traces, and log data. Well-instrumented systems yield a potentially crushing amount of this information. It requires normalizing and interpretation to be of value. To help with this, OTel offers a few core elements:
- Specifications that describe language and implementation requirements and define protocols, data types and operations for generating data.
- Instrumentation libraries and automatic instrumentation for producing data in various supported languages, in some cases without touching source code.
- A Collector that’s vendor agnostic and can receive, process, and export telemetry data.
- Software Development Kits (SDKs) that allow you to use the OTel APIs to generate data in your language of choice and to incorporate instrumentation libraries to connect with manual instrumentation.
- A Kubernetes Operator to manage the OTel Collector and auto-instrumentation.
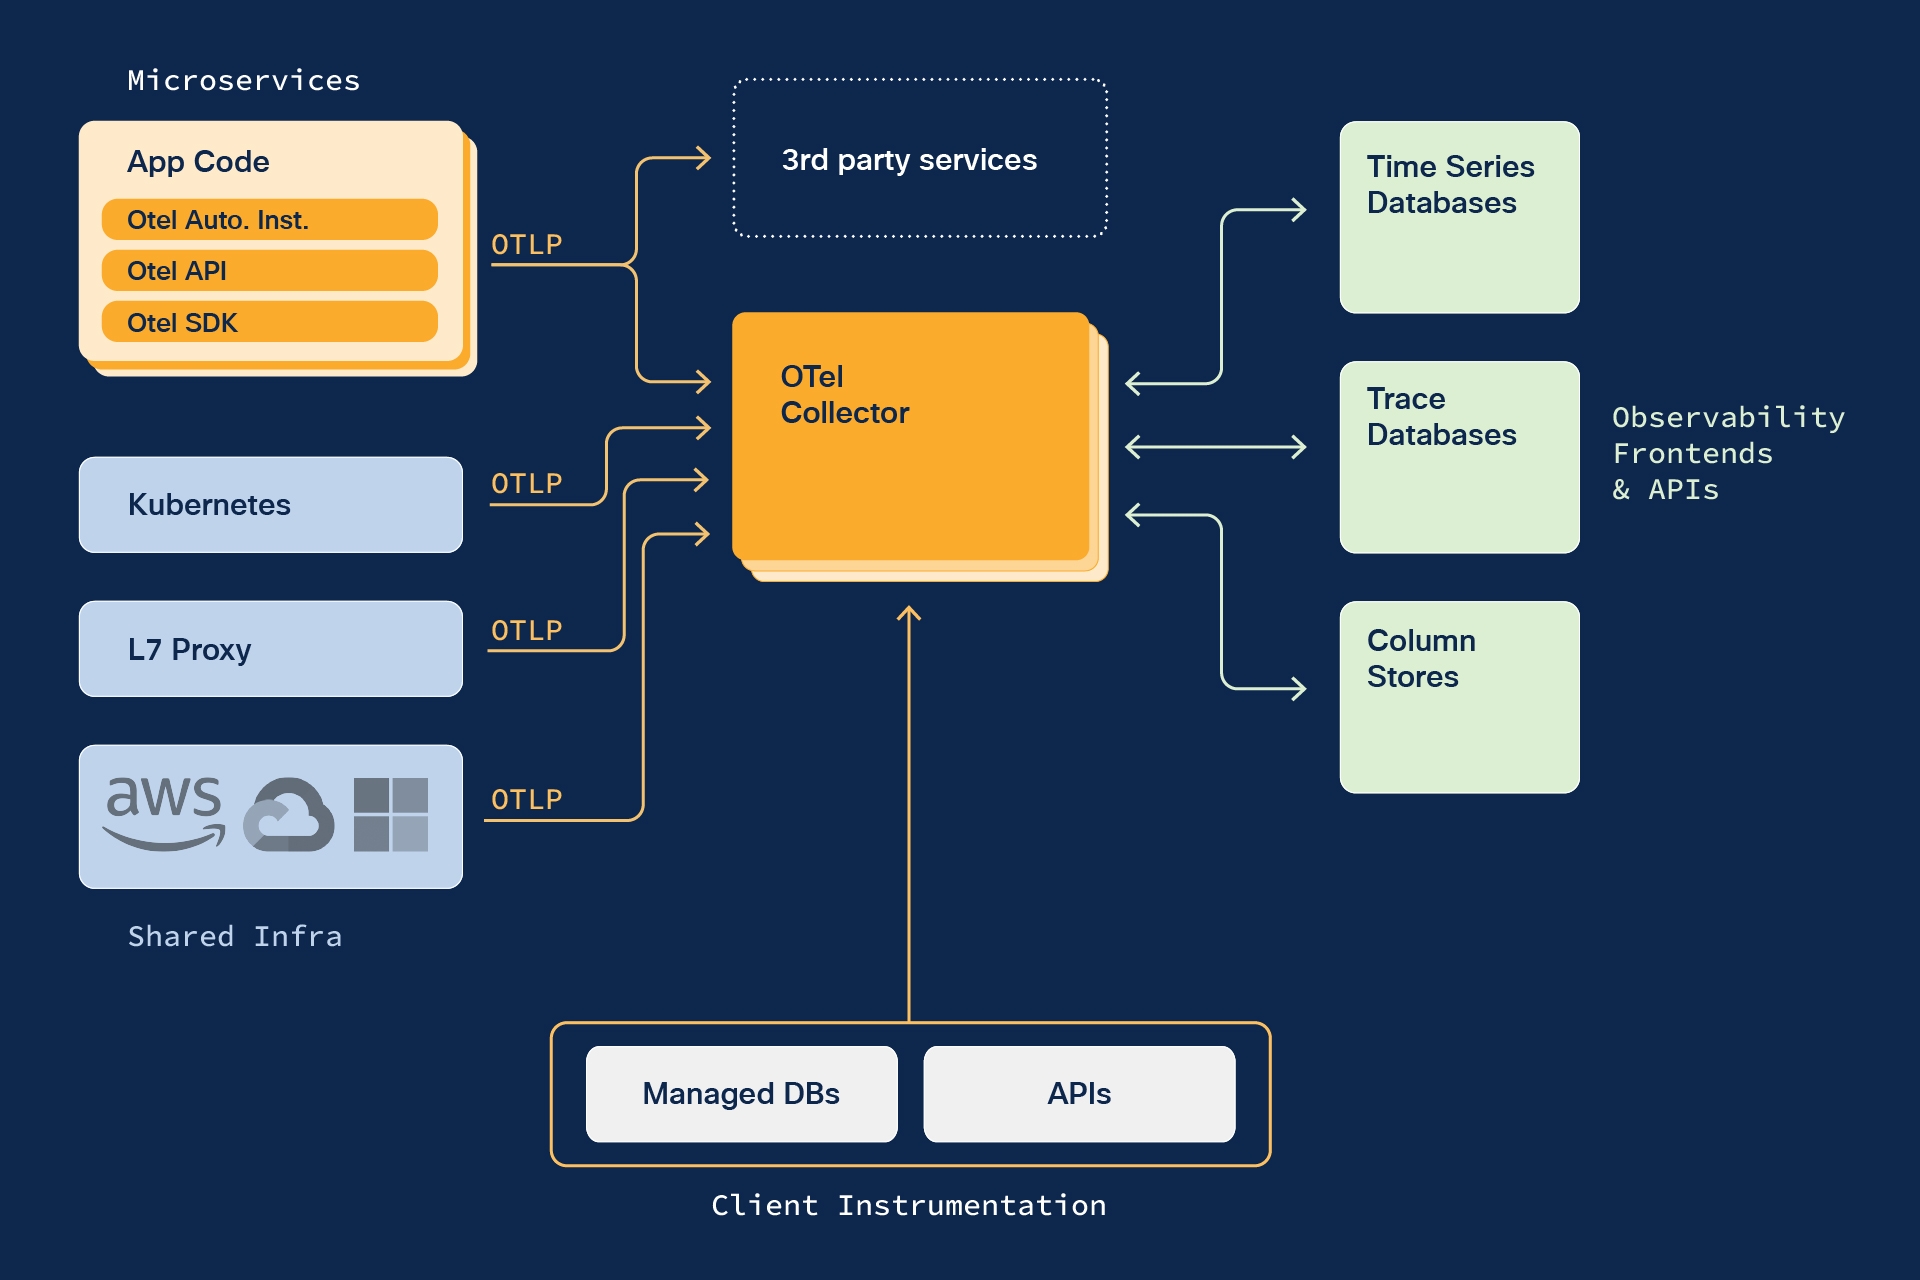
OpenTelemetry (OTel) provides an open source framework for collecting performance data
from every potentially observable component within a system, at every layer of the IT stack.
How can OpenTelemetry benefit you?
Generally, these OTel tools offer a flexible, scalable, and consistent solution to the challenge of achieving unified system observability. Because it’s open source, OTel is also cost effective. What makes it a powerful solution for the future is the fact that OTel is:
Standardized: So much of the benefit comes down to offering a single way to describe, collect, and collate data. OTel uses semantic conventions to set common names for different kinds of data and operations – useful for propagating consistent naming schemes across platforms and environments. It offers a single, vendor-agnostic instrumentation library by language for collecting traces, metrics, and logs, so you won’t need to manage multiple libraries and layers. And it features a vendor-neutral collector for receiving, processing, and exporting data in a controlled way.
Controllable: The OTel Collector removes the need to run multiple agents/collectors. It supports traces, metrics, and logs and popular open-source protocols. It gives you the flexibility to send data to multiple back ends in a host of different formats. You can set configurations to receive data in one format and export in another. The Collector also supports tail sampling, or the ability to filter traces by certain criteria and trim the volume of data you’re sending to the back end. This is useful in helping to manage costs, focus your effort on priority traces, and filter out “business-as-usual” noise.
Portable: OTel separates data collection and delivery from the tools that ingest and analyze it. It removes the need for installing proprietary or manual data collection libraries by enabling you to instrument your applications once. It defines, in a vendor-agnostic way, how data is collected and propagated, so the data pipe can be unplugged and reconnected to any number of supporting systems. From a telemetry and data collection perspective, OTel solves the issue of vendor lock-in by removing the need to customize or use proprietary vendor formats.
Supported: Seeing the need for a standard approach to instrumentation, the industry pulled distinct efforts together to form OTel. Today, more than 30 vendors natively support OTel in their commercial products. Almost 20 open-source projects, including the popular Jaeger observability framework, are integrated with it. More than 800 companies have contributed code to it, some in high volume, and nearly 1,000 developers have pitched in.
Since everyone can benefit from it and no one owns it it’s likely to evolve rapidly in ways that support, agnostically, common needs. The more widely used the framework is, the “stickier” it will become. More vendors and end users will adopt it and more contributors will extend and improve it.
OpenTelemetry at Cisco
Cisco has embraced OTel as an observability standard and as a foundational piece of its approach to full stack observability. Cisco is a major contributor to the OTel project and is using it to connect its various observability tools, including AppDynamics, ThousandEyes, and Panoptica.
You may also be interested in:
- Visit the Cisco FSO resource hub
- “From Silos to Synergy: Bridging the Gap Between App Development and IT Ops,” by Matt DeNapoli
- Cisco Developer: Full Stack Observability
- Cisco Full Stack Observability At-a-Glance
- Watch the on-demand webinar, “Cisco Full Stack Observability in Action- A deeper look
- Watch the on-demand webinar, “Secure, Always-On & Exceptional Experiences with Full Stack Observability
- Get your questions answered in the Cisco Developer Community


Great overview Mel!