
More data does not mean better observability
If you’re familiar with observability, you know most teams have a “data problem.” That is, observability data has exploded as teams have modernized their application stacks and embraced microservices architectures.
If you had unlimited storage, it’d be feasible to ingest all your metrics, events, logs, and traces (MELT data) in a centralized observability platform . However, that is simply not the case. Instead, teams index large volumes of data – some portions being regularly used and others not. Then, teams have to decide whether datasets are worth keeping or should be discarded altogether.
For the past few months I’ve been playing with a tool called Edge Delta to see how it might help IT and DevOps teams to solve this problem by providing a new way to collect, transform, and route your data before it is indexed in a downstream platform, like AppDynamics or Cisco Full-Stack Observability.
What is Edge Delta?
You can use Edge Delta to create observability pipelines or analyze your data from their backend. Typically, observability starts by shipping all your raw data to central service before you begin analysis. In essence, Edge Delta helps you flip this model on its head. Said another way, Edge Delta analyzes your data as it’s created at the source. From there, you can create observability pipelines that route processed data and lightweight analytics to your observability platform.
Why might this approach be advantageous? Today, teams don’t have a ton of clarity into their data before it’s ingested in an observability platform. Nor do they have control over how that data is treated or flexibility over where the data lives.
By pushing data processing upstream, Edge Delta enables a new kind of architecture where teams can have…
- Transparency into their data: “How valuable is this dataset, and how do we use it?”
- Controls to drive usability: “What is the ideal shape of that data?”
- Flexibility to route processed data anywhere: “Do we need this data in our observability platform for real-time analysis, or archive storage for compliance?”
The net benefit here is that you’re allocating your resources towards the right data in its optimal shape and location based on your use case.
How I used Edge Delta
Over the past few weeks, I’ve explored a couple different use cases with Edge Delta.
Analyzing NGINX log data from the Edge Delta interface
First, I wanted to use the Edge Delta console to analyze my log data. To do so, deployed the Edge Delta agent on a Kubernetes cluster running NGINX. From here, I sent both valid and invalid http requests to generate log data and observed the output via Edge Delta’s pre-built dashboards.
Among the most useful screens was “Patterns.” This feature clusters together repetitive loglines, so I can easily interpret each unique log message, understand how frequently it occurs, and whether I should investigate it further.
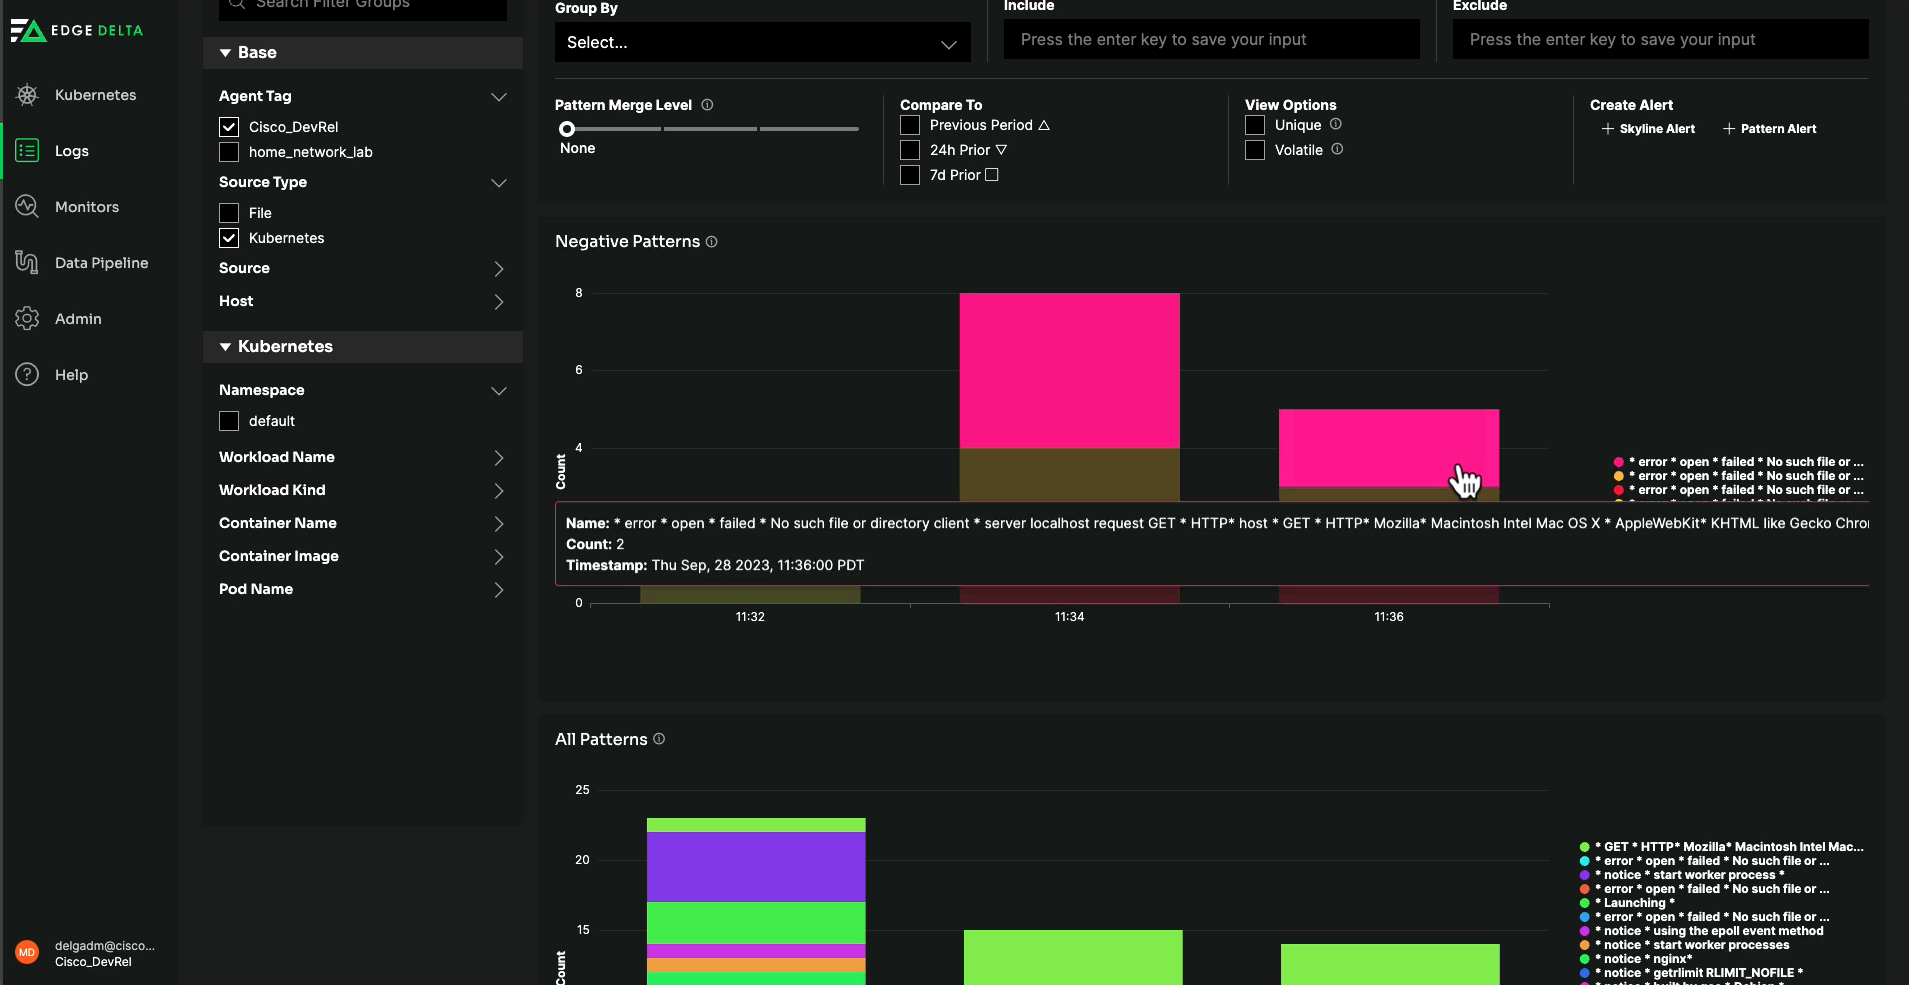 Edge Delta’s Patterns feature makes it easy to interpret data by clustering
together repetitive log messages and provides analytics around each event.
Creating pipelines with Syslog data
Second, I wanted to manipulate data in flight using Edge Delta observability pipelines. Here, I installed the Edge Delta agent on my Mac OS. Then I exported Syslog data from my Cisco ISR1100 to my Mac.
From within the Edge Delta interface, I configured the agent to listen on the appropriate TCP and UDP ports. Now, I can apply processor nodes to transform (and otherwise manipulate) my data before it hits my downstream analytics platform.
Specifically, I applied the following processors:
- Mask node to obfuscate sensitive data. Here, I replaced social security numbers in my log data with the string ‘REDACTED’.
- Regex filter node which passes along or discards data based on the regex pattern. For this example, I wanted to exclude DEBUG level logs from downstream storage.
- Log to metric node for extracting metrics from my log data. The metrics can be ingested downstream in lieu of raw data to support real-time monitoring use cases. I captured metrics to track the rate of errors, exceptions, and negative sentiment logs.
- Log to pattern node which I alluded to in the section above. This creates “patterns” from my data by grouping together similar loglines for easier interpretation and less noise.
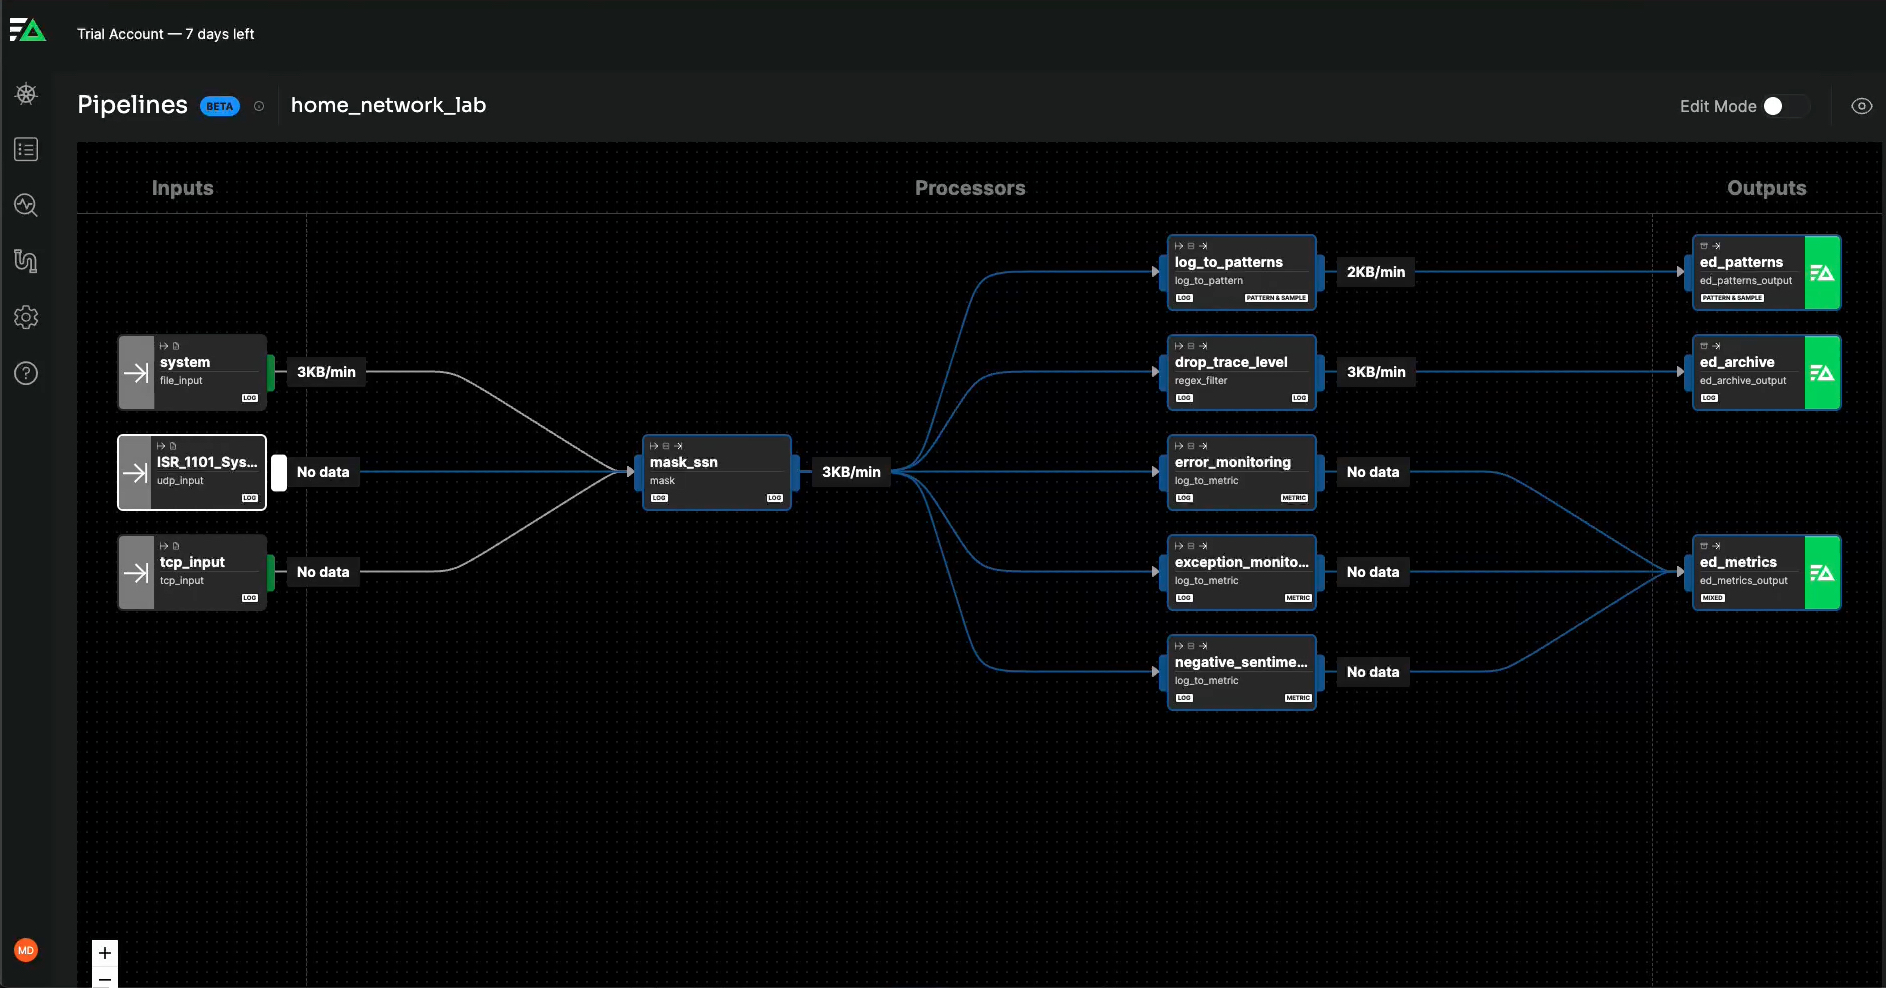 Through Edge Delta’s Pipelines interface, you can apply processors
to your data and route it to different destinations.
For now all of this is being routed to the Edge Delta backend. However, Edge Delta is vendor-agnostic and I can route processed data to different destinations – like AppDynamics or Cisco Full-Stack Observability – in a matter of clicks.
Conclusion
If you’re interested in learning more about Edge Delta, you can visit their website (edgedelta.com). From here, you can deploy your own agent and ingest up to 10GB per day for free. Also, check out our video on the YouTube DevNet channel to see the steps above in action. Feel free to post your questions about my configuration below.
Related resources
- Learn more about Cisco Full-Stack Observability
- Learn more about AppDynamics


