
Background
One common request from customers is a Network Operations Center dashboard view for Cisco DNA Center. They would like this to be open-authentication (no need for credentials) and automatically refresh. Critical data from Cisco DNA Center, such as network device and user health can be displayed and updated for the operations team on a large screen.
Using common tools like Influx (time series), telegraf (agent) and Grafana (visualization) (TIG) it is trivial to build a small dashboard and expose it via HTTP. Many customers are already using these tools for other dashboards.
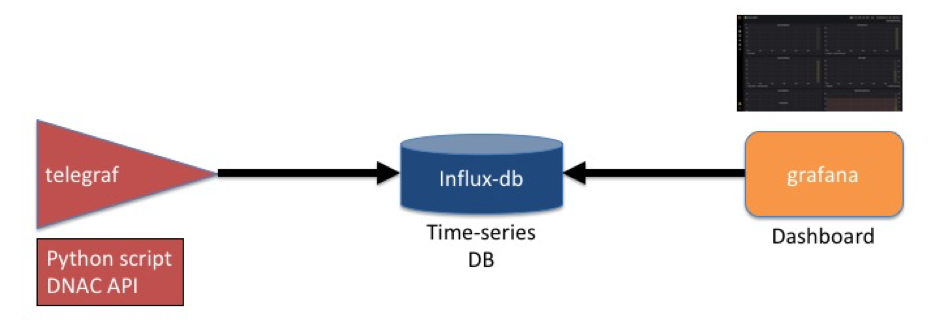
The only real work I need to do is write a small python script to plug into telegraf to collect network and user health data from Cisco DNA Center and convert it to a simple JSON format.
For this script I am going to use the newly released Cisco DNA Center python SDK.
Getting started
The first step is to download the code from github and create a python virtual environment. The virtualenv is recommended, but optional.
git clone https://github.com/CiscoDevNet/DNAC-NOC.git
python3 -mvenv env3
source env3/bin/activate
Next install the python requirements (the dnacentersdk). It is a good idea to update pip first, as older versions may have issues installing the SDK.
pip install -U pip
pip install -r DNAC-NOC/requirements.txt
Now test the script to ensure it is working. By default the script will try to connect to the DevNet always on sandbox. The data collected includes device health and counts as well as user (wired and wireless) health and counts. There is more data that you can collect by modifying the script.
$ ./DNAC-NOC/dnac_assurance.py
{"Core.count": null, "totalcount": 14, "WIRELESS-client.count": 80, "WLC.count": null,
"WIRED-client.count": 2, "AP.count": null, "WIRED-client.value": 100, "Access.count": null,
"totalscore": 100, "WIRELESS-client.value": 25, "AP.score": 100, "Router.score": 100,
"ALL-client.value": 27, "Router.count": null,
"Access.score": 100, "Core.score": 100, "WLC.score": 100, "ALL-client.count": 82}
Script Detail
There are two APIs used to get this data seen in the code below.
“get_overall_network_health” returns the health (and count) of the network devices. They are broken into categories (WLC, router,AP, access etc). It requires a timestamp, but that can be left empty (returning the latest).
“get_overall_client_health” returns the health (and count) of clients. In this case I need to provide a timestamp. That is the current time (in epoch) converted to milli-epoch (i.e. multiply by 1000).
network_health= dnac.networks.get_overall_network_health(timestamp='')

timestamp = int(time.time() * 1000)
client_health= dnac.clients.get_overall_client_health(timestamp='{}'.format(timestamp))
Telegraf configuration
I am assuming you have telegraf setup and integrated into influxdb. As there are many blogs outlining how to install these components, I will skip over these basic steps.
The custom python script above will be run every minute and update a time series database in influxdb. The custom.conf file contains information on how to run the script. You need to edit this file to change the path for the python virtual environment and the script.
Once you copy the script, restart telegraf so the custom script will be executed. The script is called every minute as the client health score gets updated every minute.
sudo cp DNAC-NOC/telegraf.d/custom.conf /etc/telegraf/telegraf.d/
sudo systemctl restart telegraf
You will now see data being populated in influxdb.
$ influx
Connected to http://localhost:8086 version 1.7.8
InfluxDB shell version: 1.7.8
> use telegraf
Using database telegraf
> show field keys from "exec_dnac"
name: exec_dnac
fieldKey              fieldType
--------              ---------
ALL-client.count      float
ALL-client.value      float
AP.score              float
Access.score          float
Distribution.score    float
Router.score          float
WIRED-client.count    float
WIRED-client.value    float
WIRELESS-client.count float
WIRELESS-client.value float
WLC.score             float
totalcount            float
totalscore            float
Grafana configuration
The final step is to import a json definition of the DNAC dashboard into gafana.
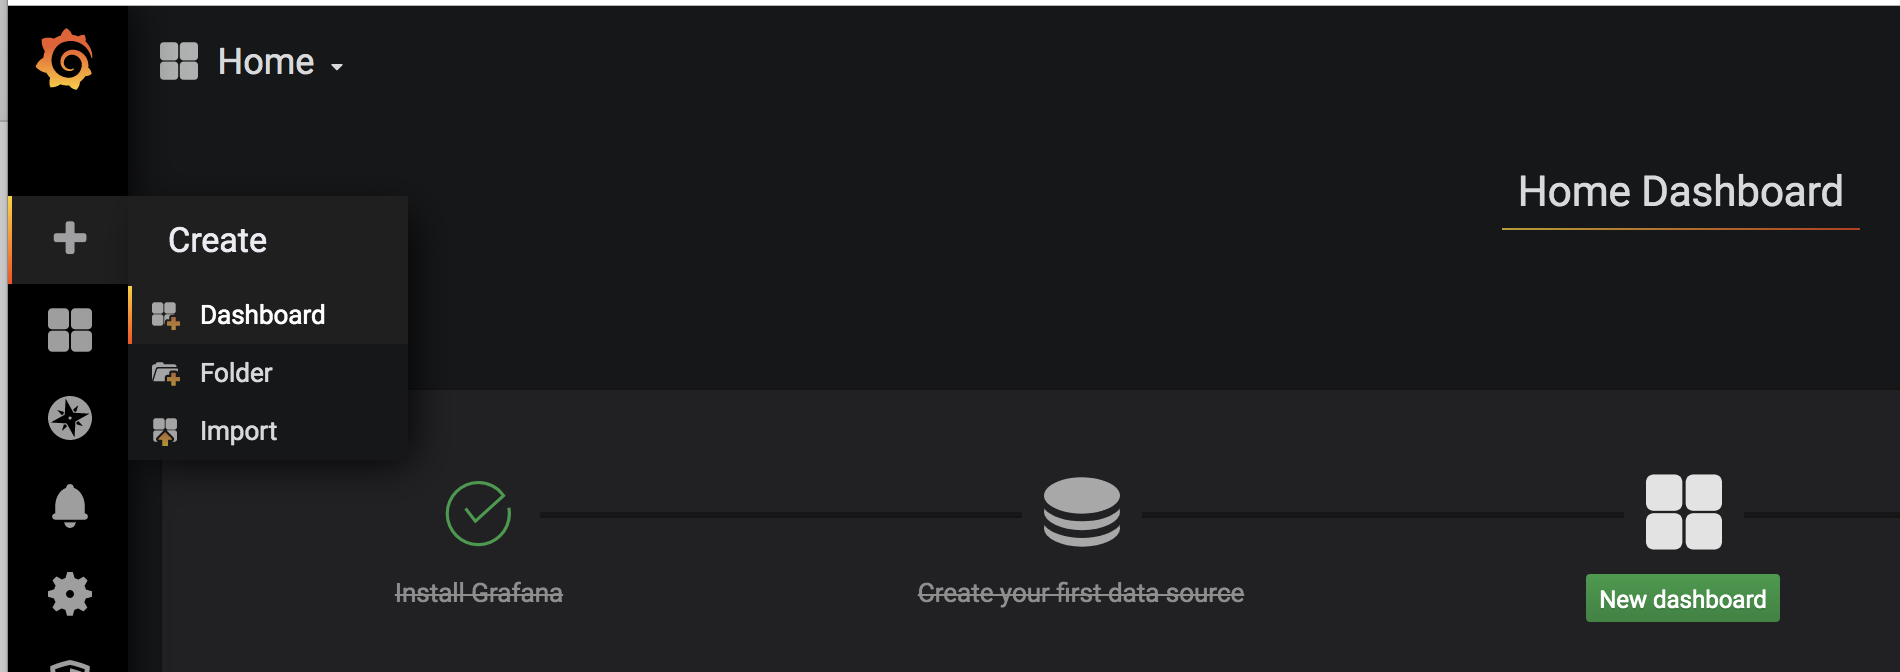
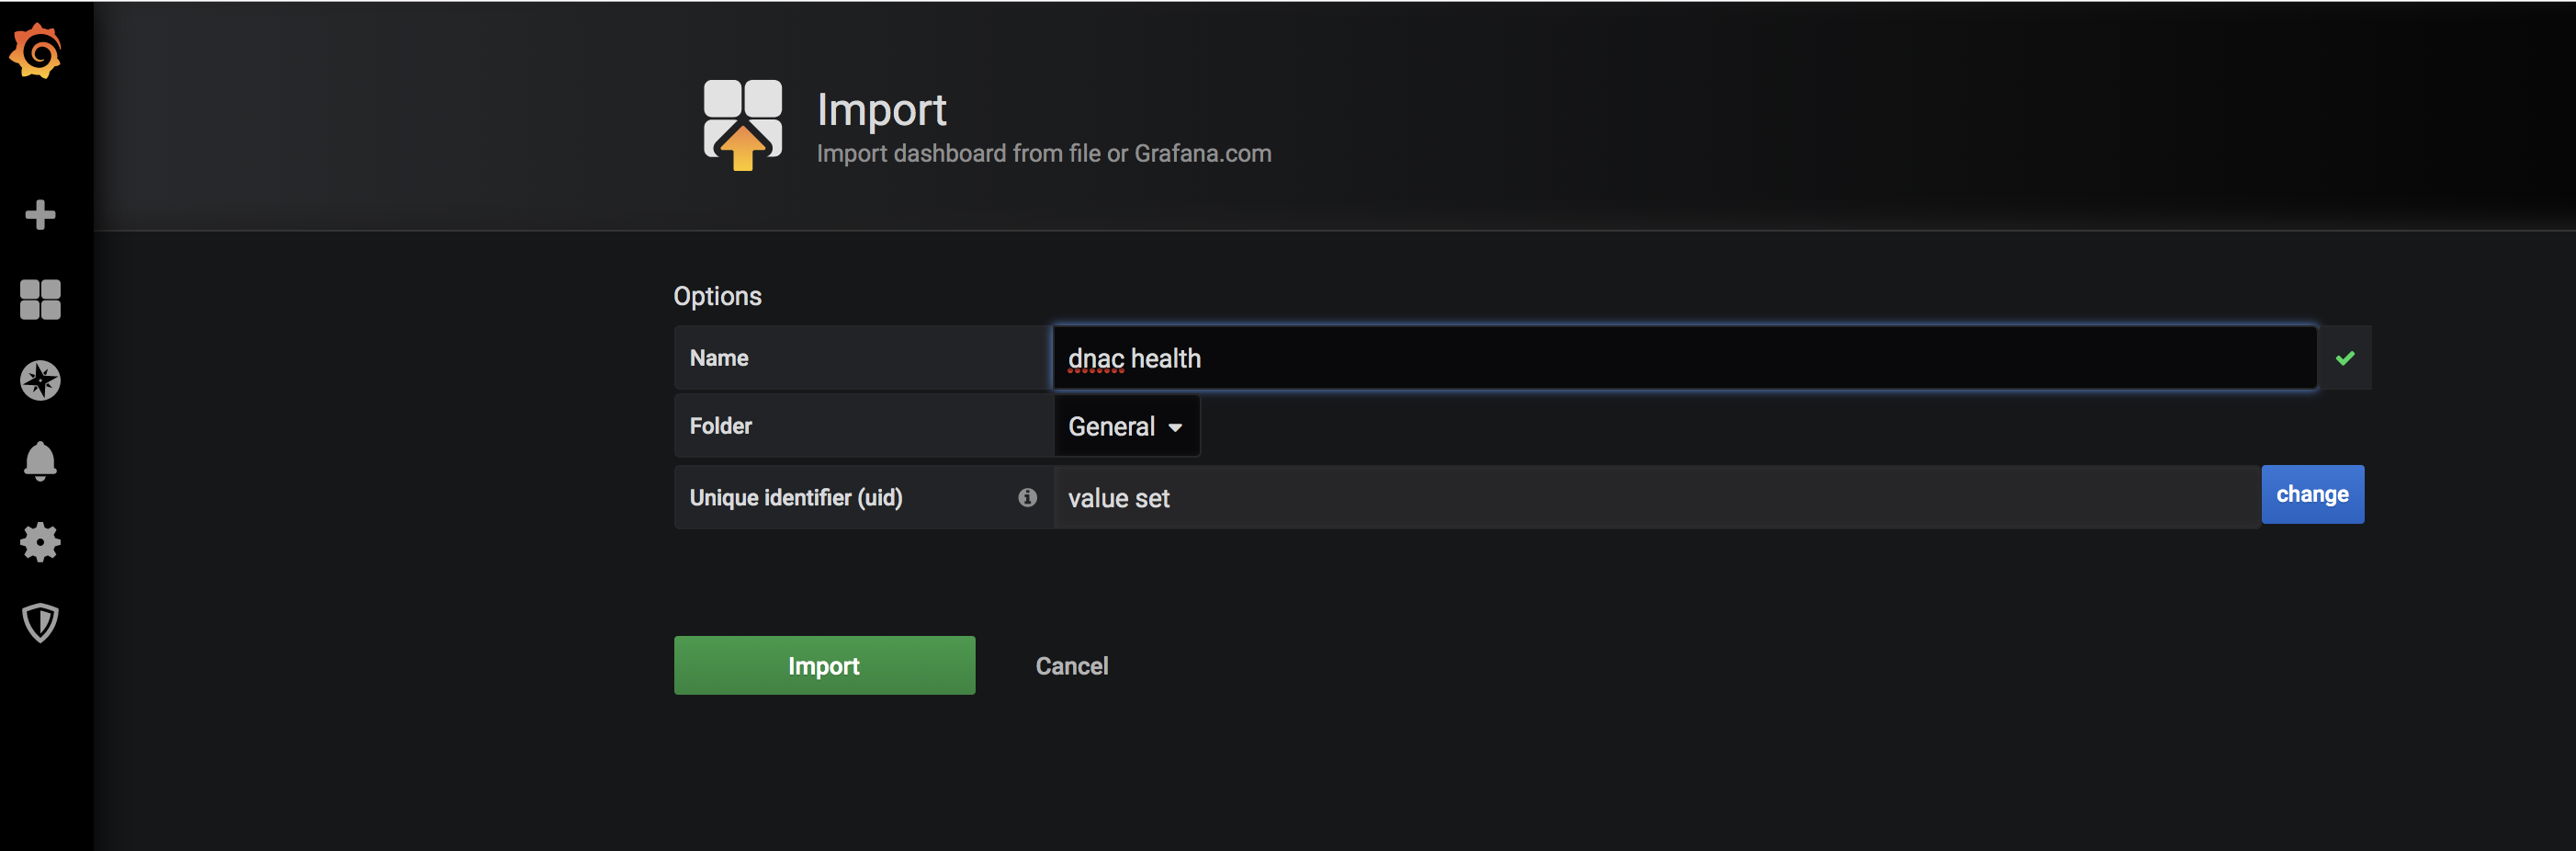
First browse to gafana homepage (typically port 3000). The select “+” -> create -> import
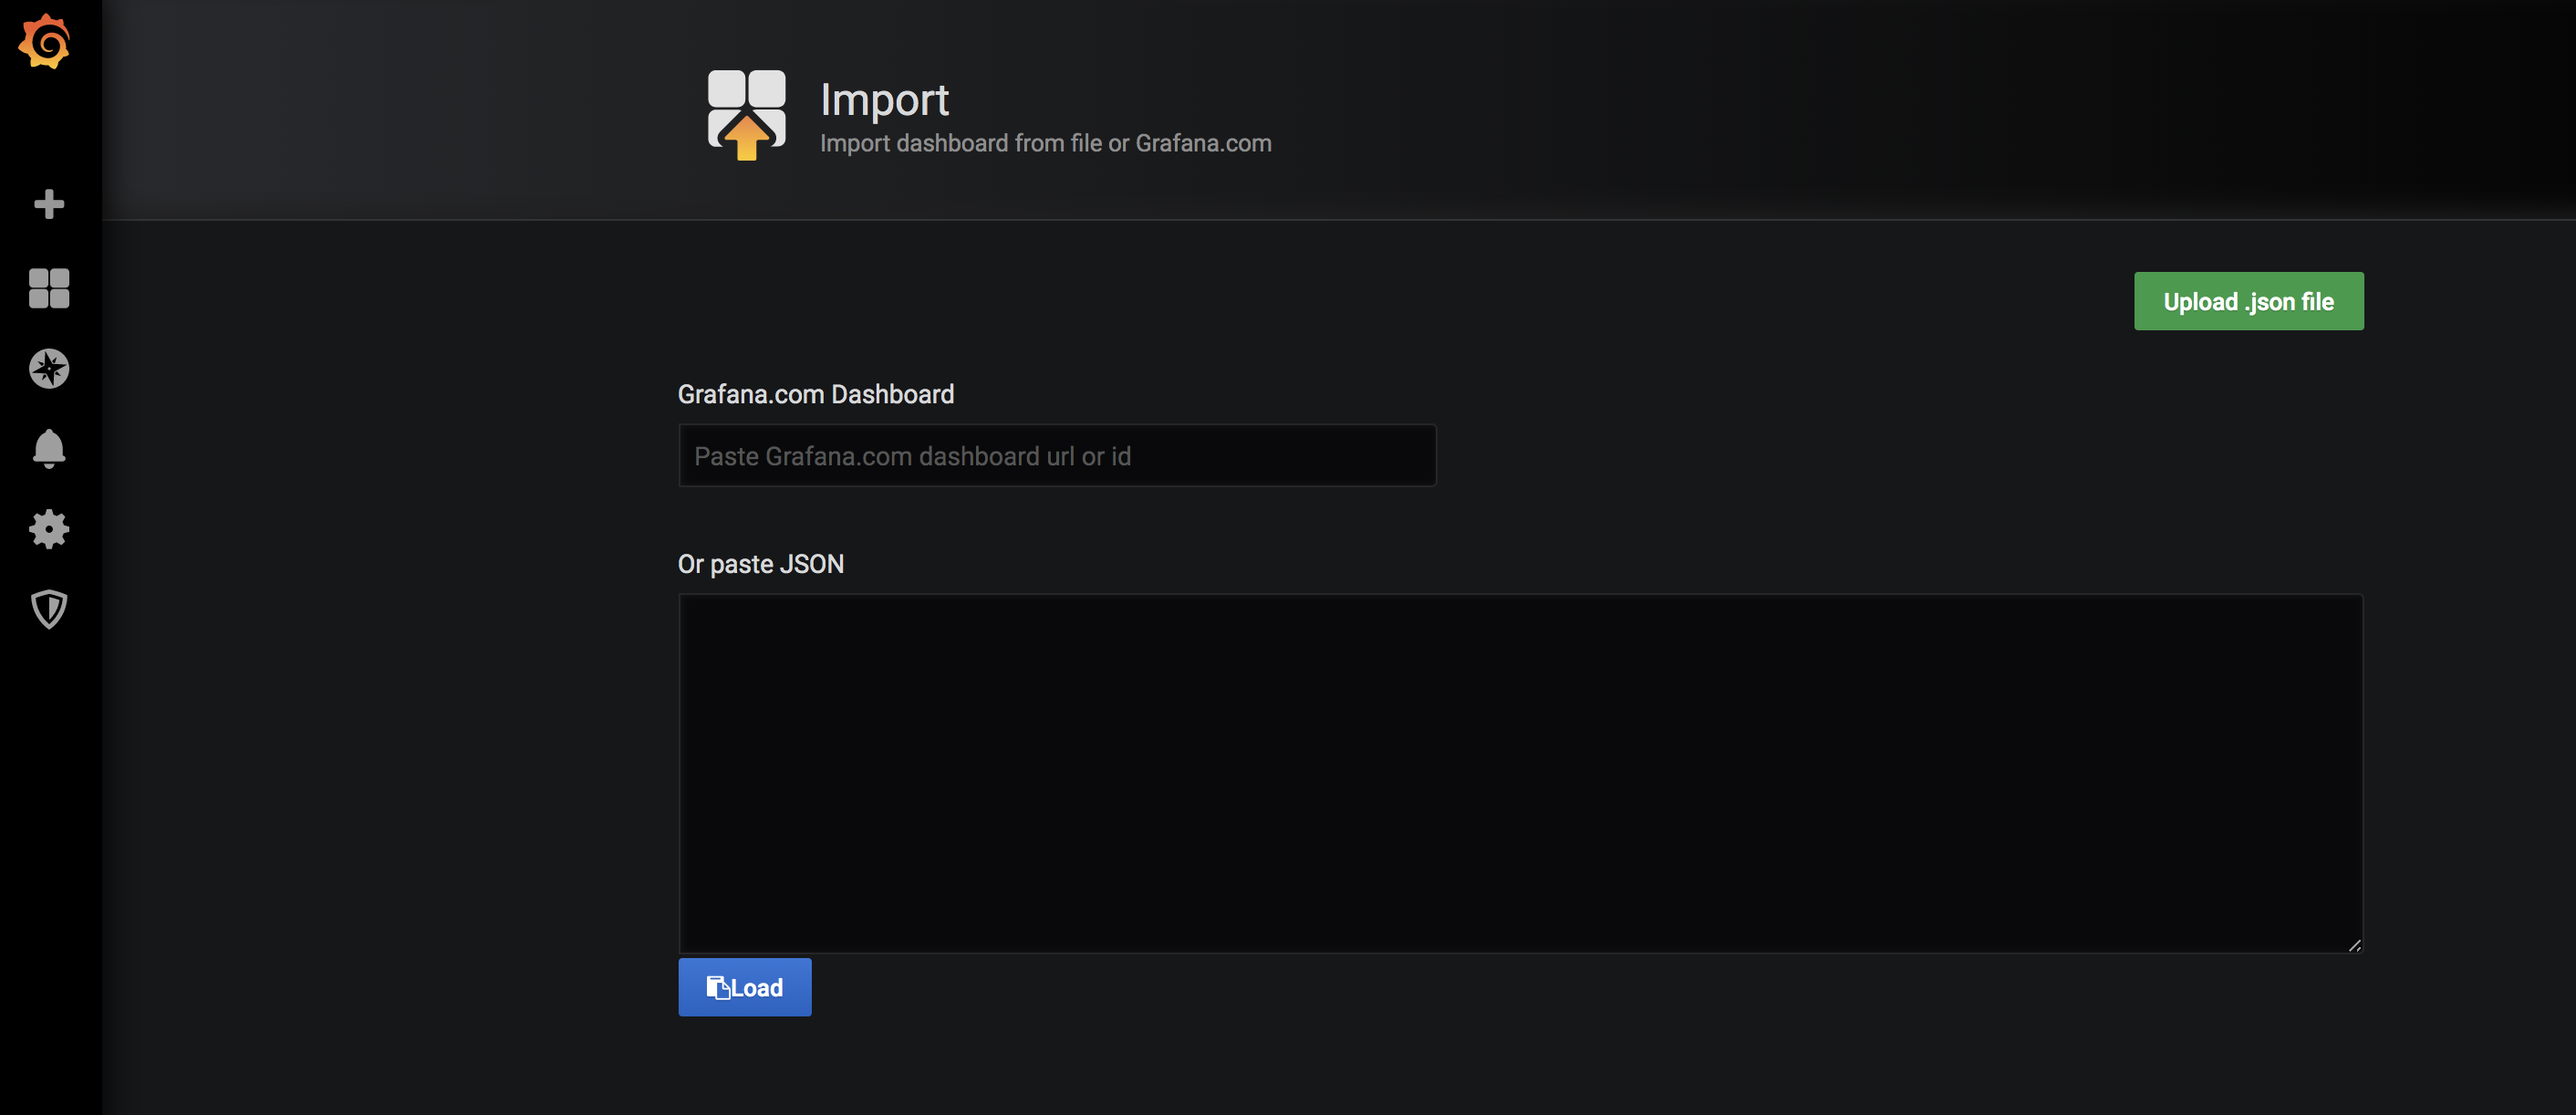
Next select “upload .json file”
The select “grafana/dashboard.json” from the files you downloaded from GitHub.
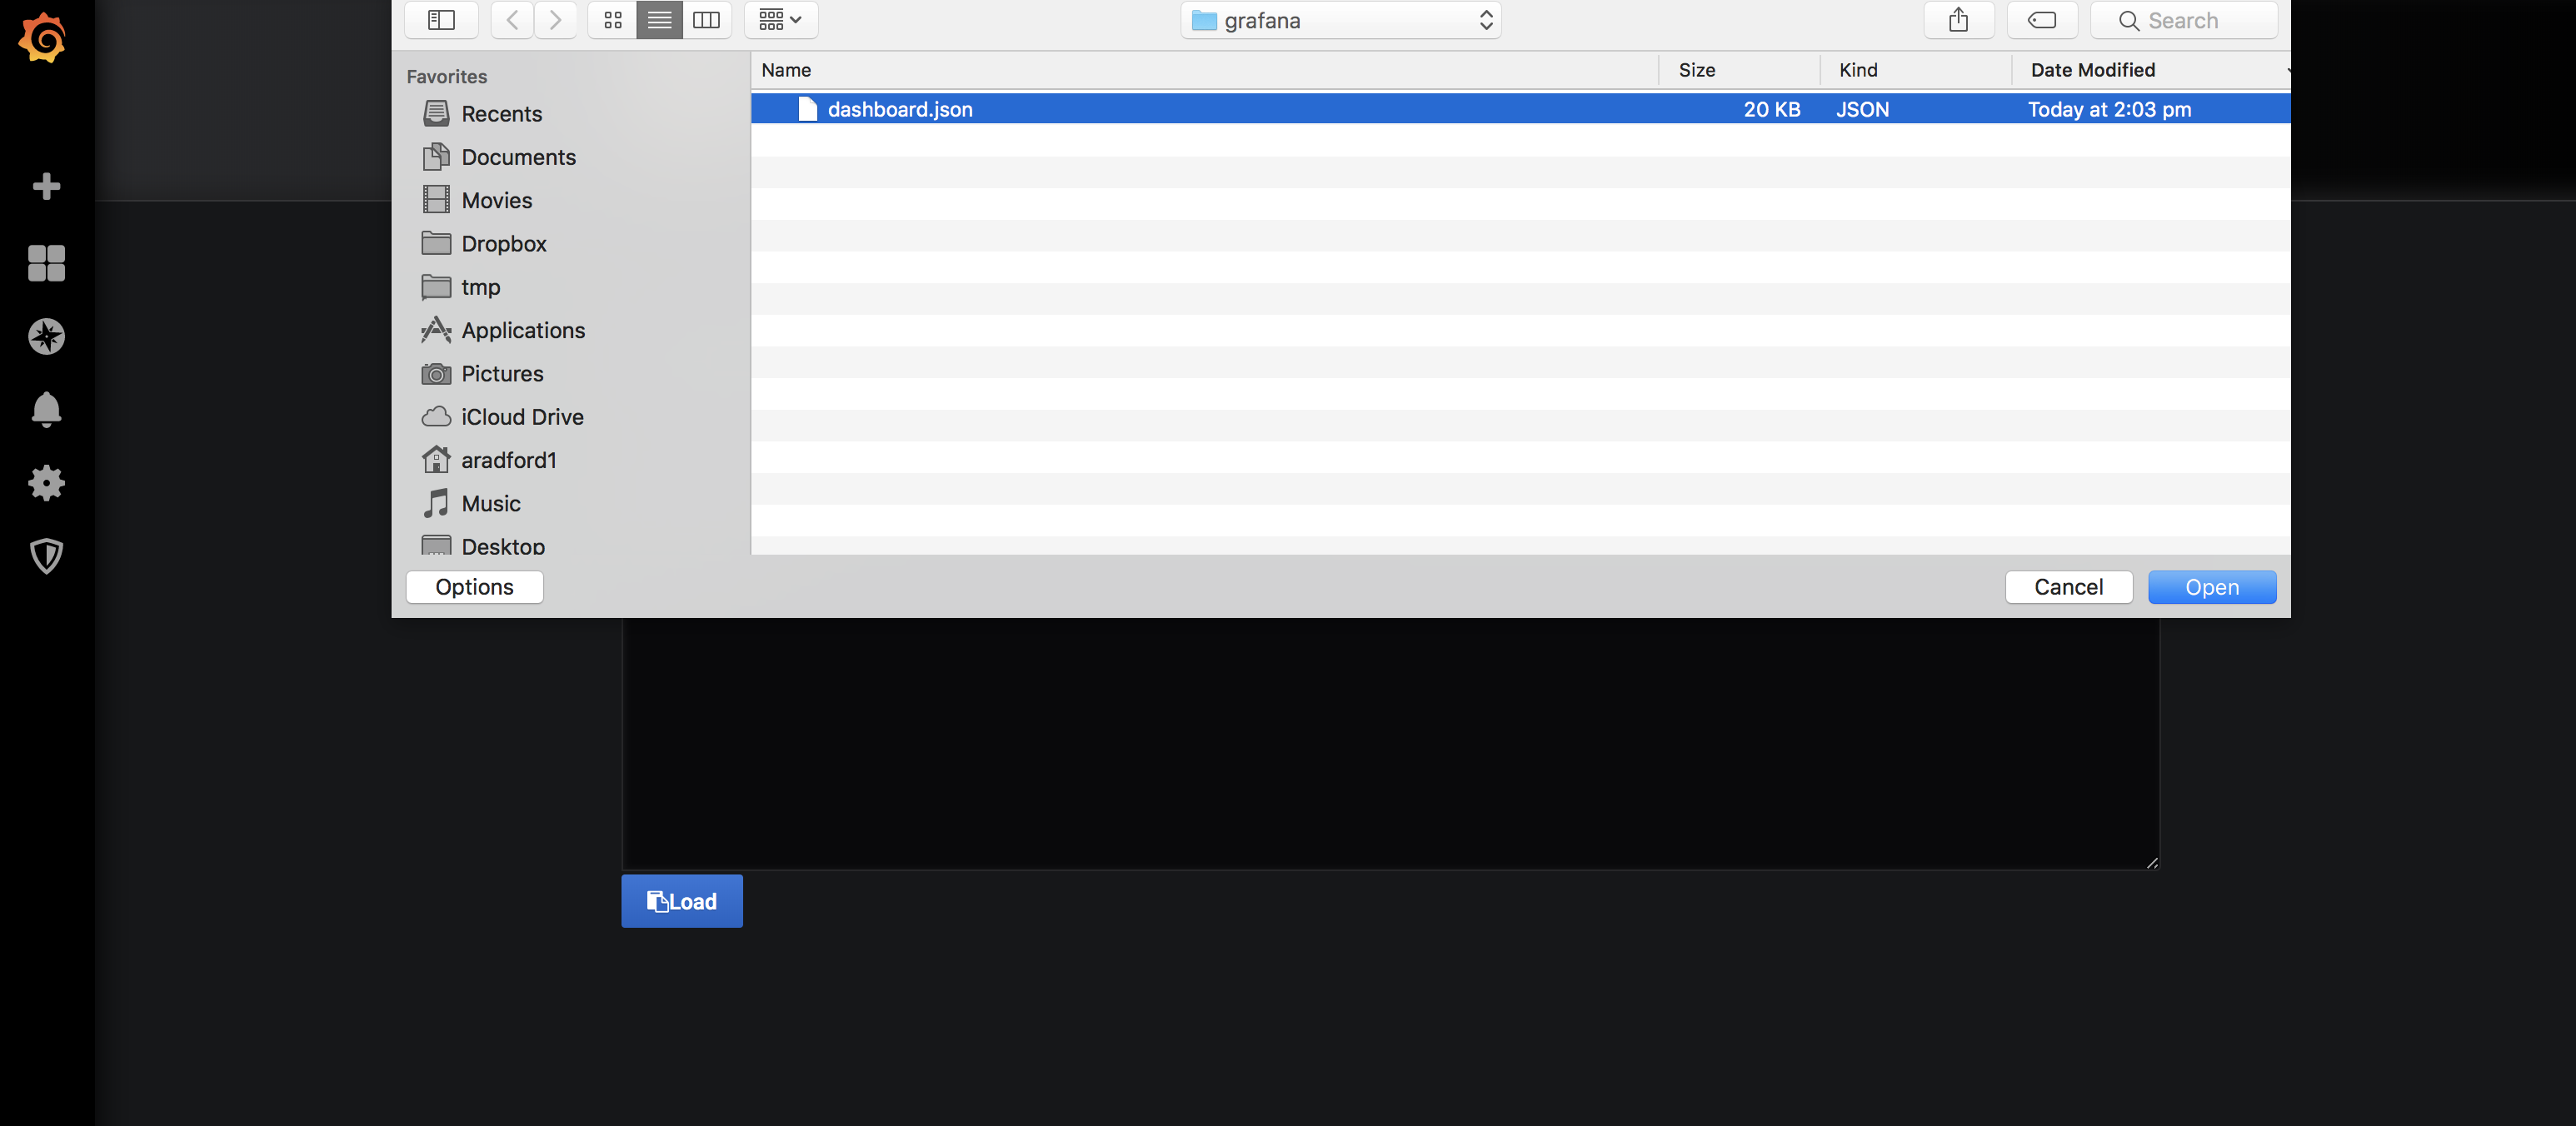
Then select Import.
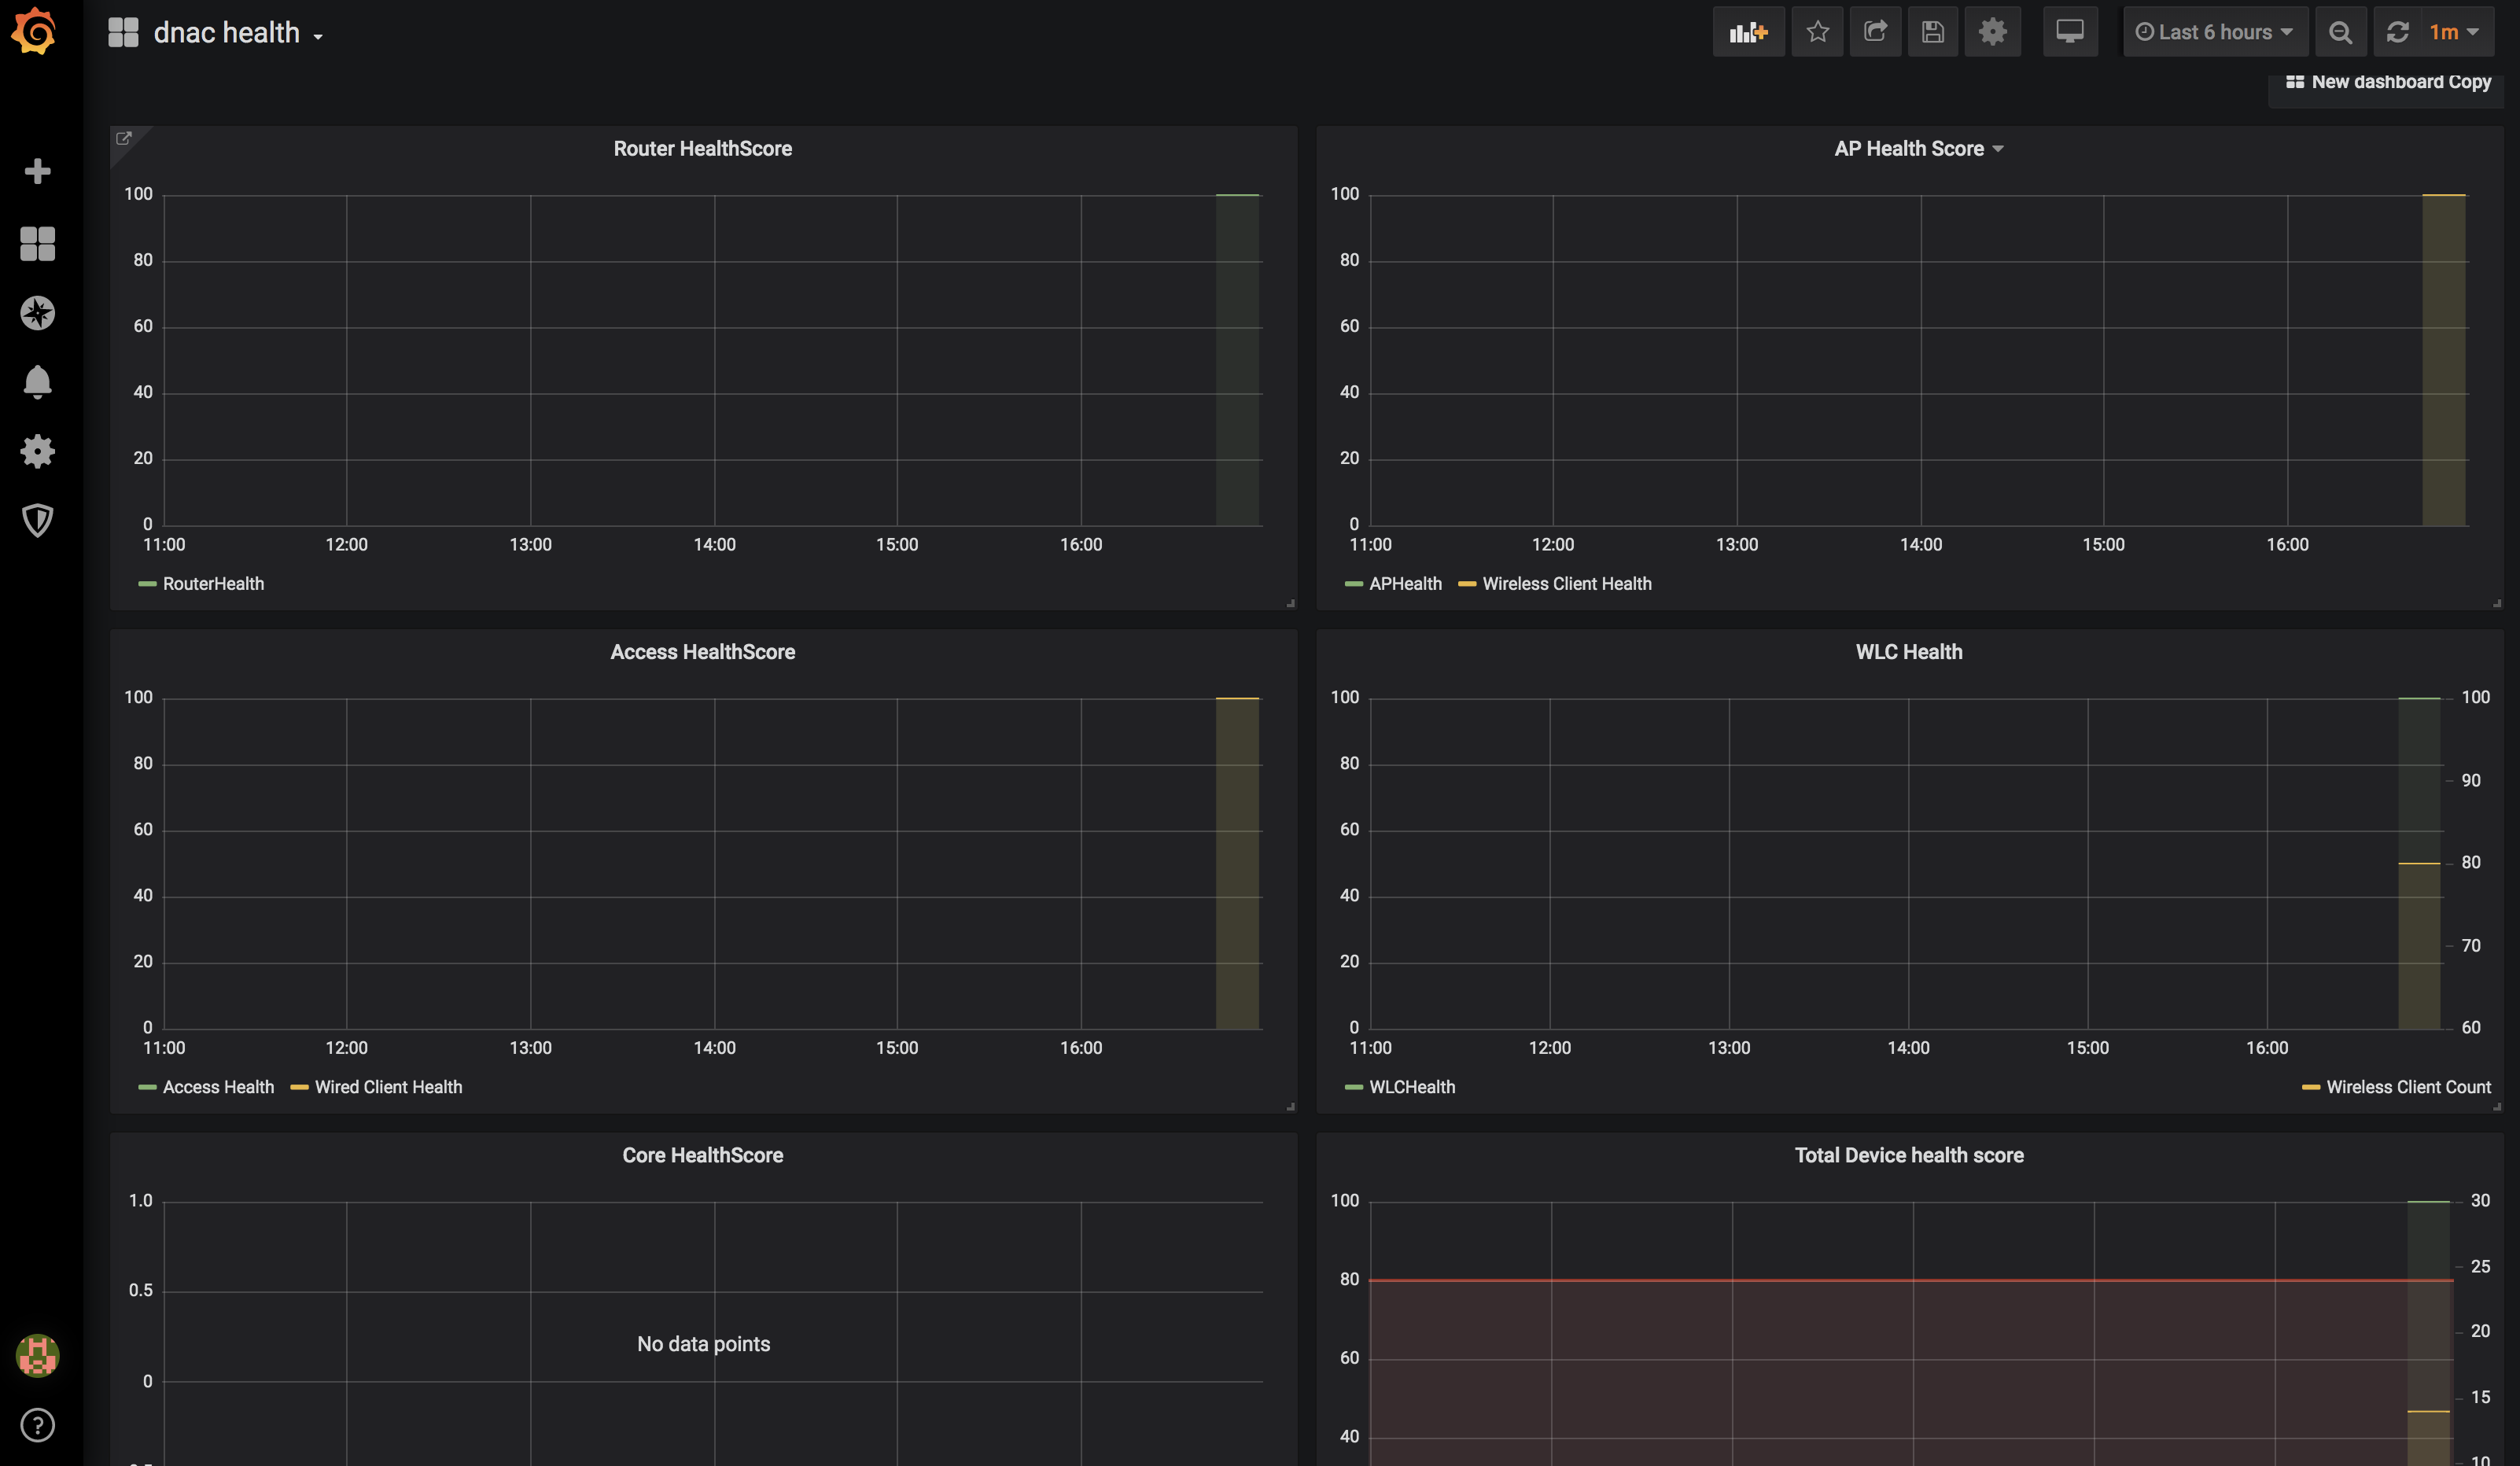
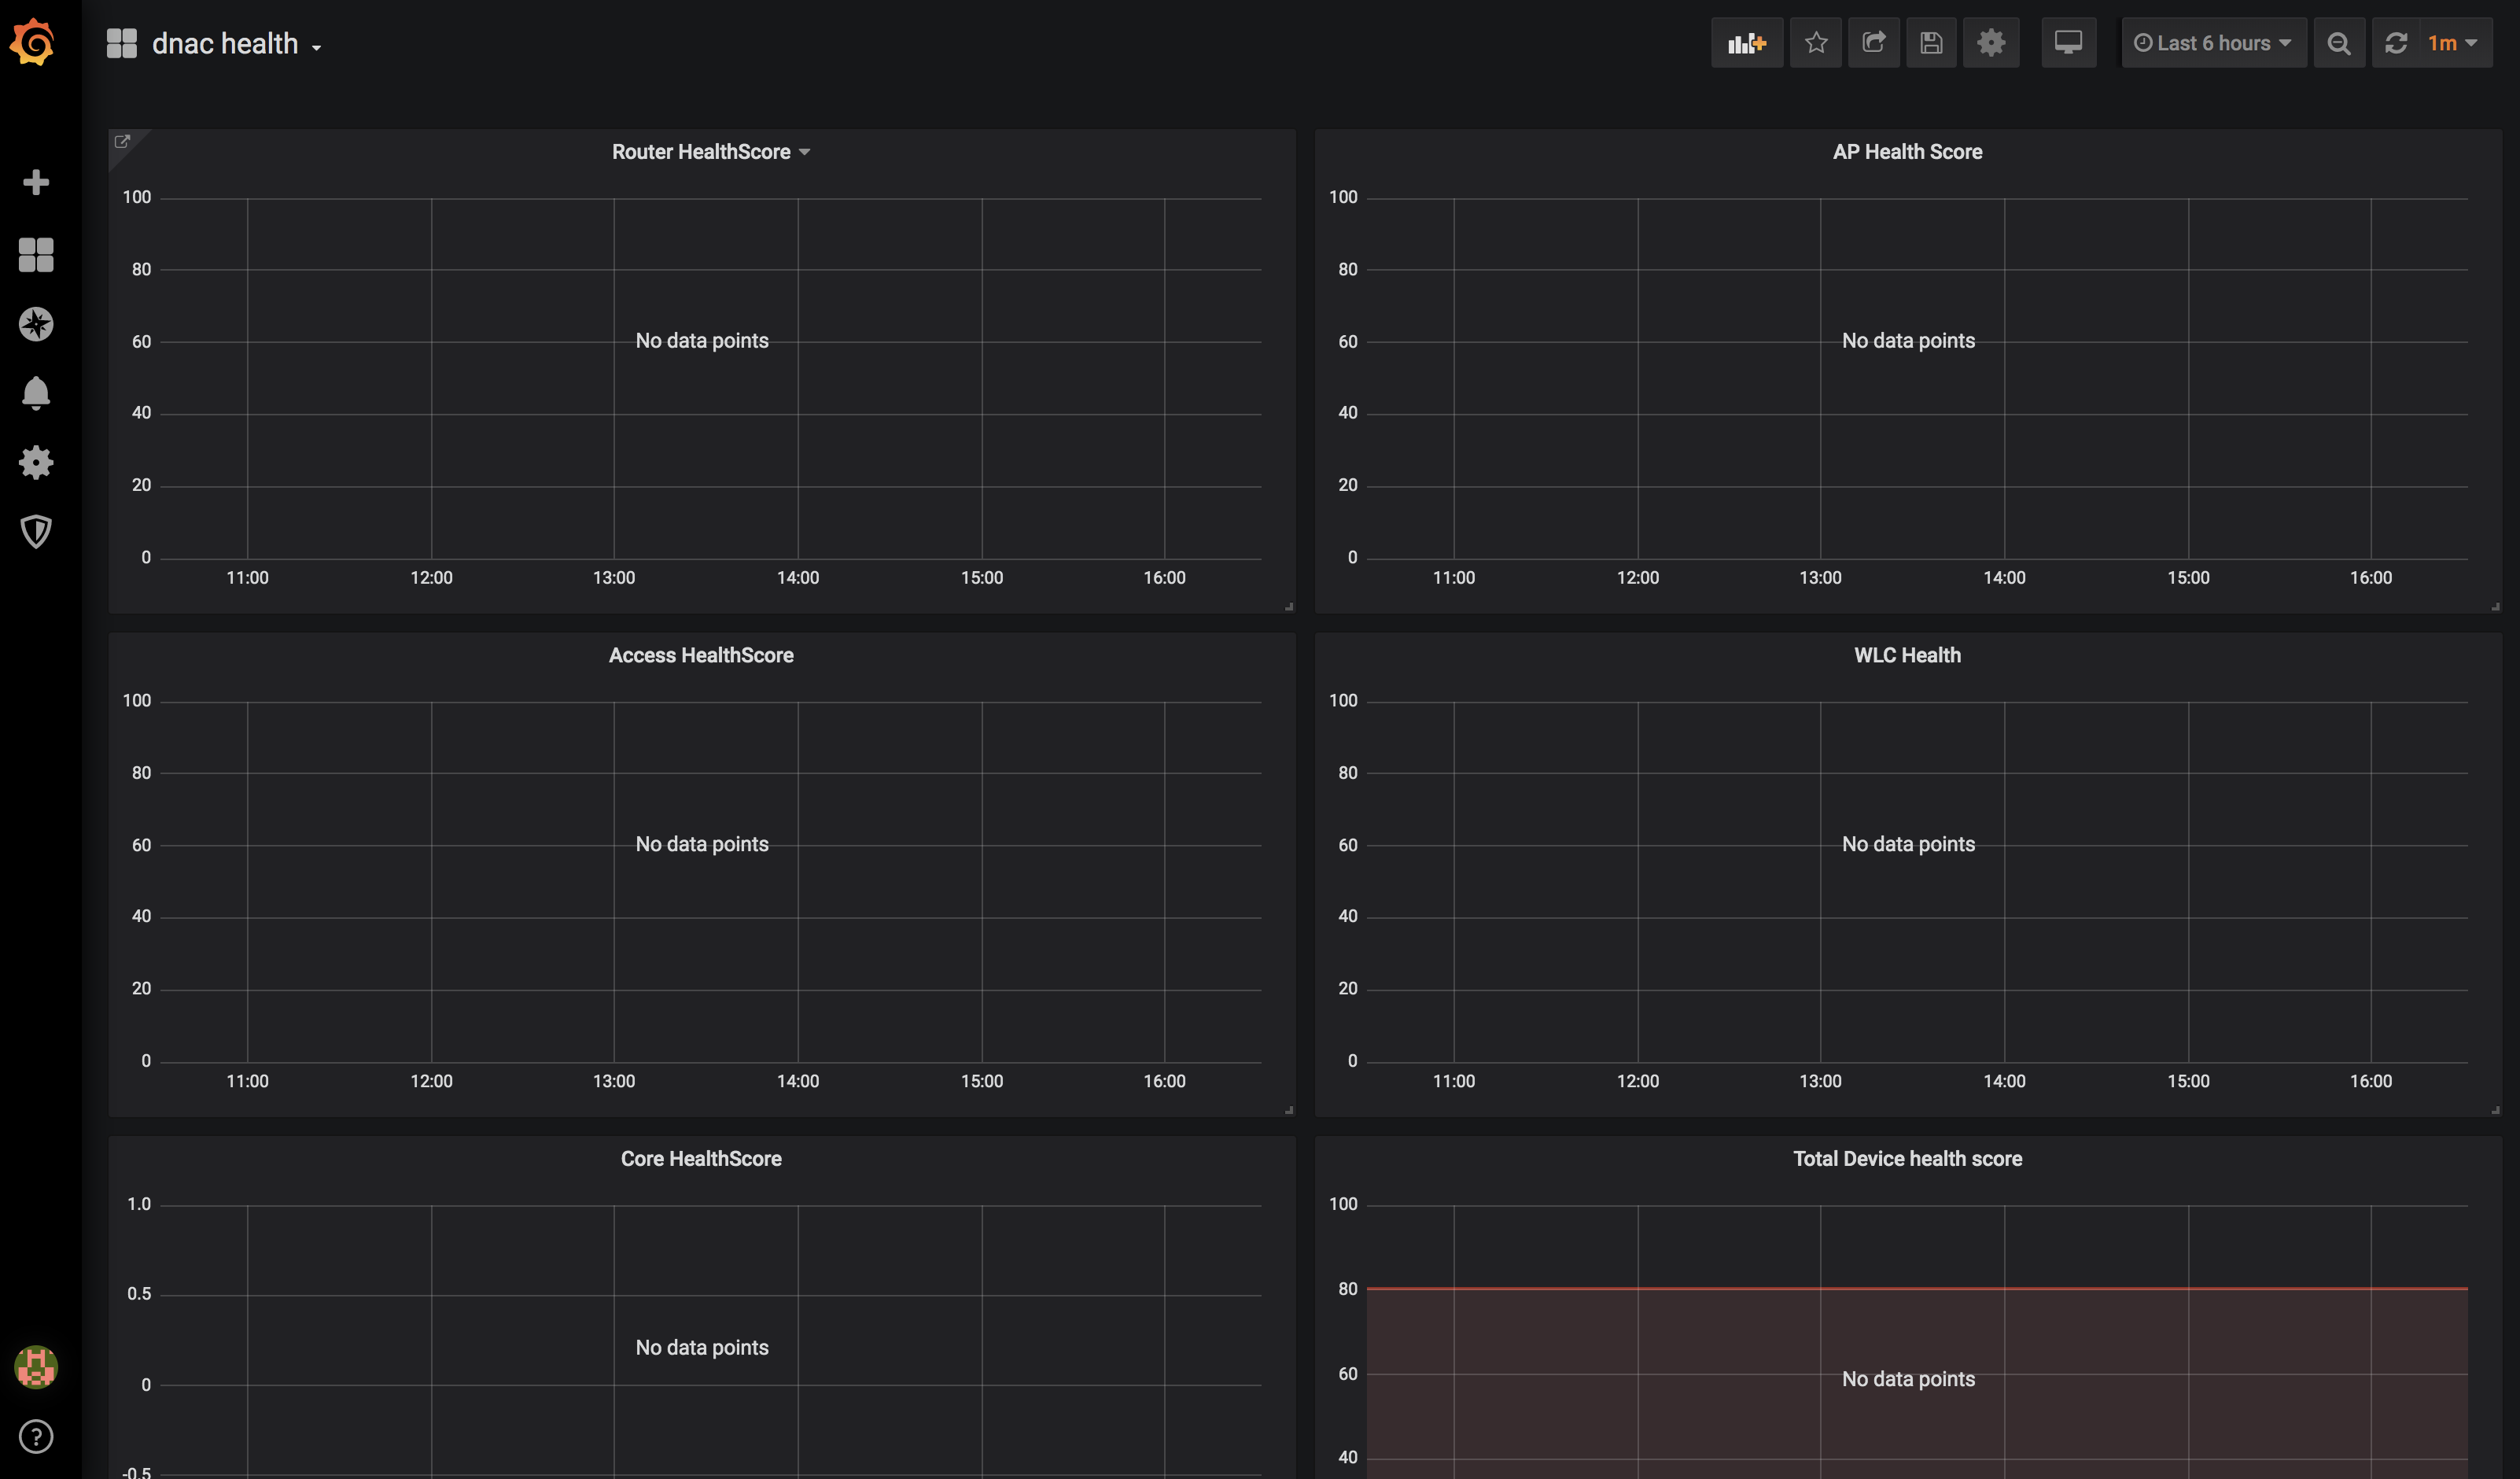
Very soon you should see the dashboard being populated.
What Next?
It is very easy to customise this dashboard further in Grafana. For example, add the wired client count, or AP count to one of the dashlets.
There are a number of other blogs in this series on Cisco DNA Center that aim to help you get more out of the platform.
In the meantime, visit the new Cisco DNA Center.
Thanks for reading. @AdamRadford123
We’d love to hear what you think. Ask a question or leave a comment below.
And stay connected with Cisco DevNet on social!
Twitter @CiscoDevNet | Facebook | LinkedIn
Visit the new Developer Video Channel


Nice work Adam – provides an answer to a common request from customers.
Very useful! Thanks, Adam
Thanks Yossi
That's a great post Adam, both for motivation and to get us started.
Thank you!
So it's not necessary to setup the datasource pointing to influxdb in Grafana? Or is that included somehow in the json file?
Yes, the connection between influx and Grafana is required. I was assuming the infra (Telegraf, Influx, Grafana) was in place.
The json referencecs the "Default" connection to Influx.