
 This article is authored by Matt Schmitz,
Technical Solutions Specialist,
Cisco’s Global Virtual Engineering (GVE) DevNet team.
Visit the GVE DevNet GitHub page
Where are my Metrics?
Networks continue to get more complex with so many new devices and services to support – but there’s one constant that never changes: the need for good monitoring tools! It’s all about having the right data points at the right time and presented in the right way.
With IoT sensors becoming more common & many devices coming with embedded sensors, we have more information available than ever before. Now the question becomes: “How do we use all of this information?” While some sensors may offer their own custom tools or reporting software, others might only expose an API. In either case, the metrics won’t be helpful if we can’t find or use the data in a way that works for us.
So how do we bring all of our sensor telemetry into a single place and display it in a useful way? One method is to write scripts to query all our sensors & devices, then push those data points into a time-series database, like InfluxDB. Once we have all that data collected in one place, we can use Grafana to create custom dashboards to keep track of what we care about. This way we can pull all of our telemetry into one single reporting tool, then build custom graphs & dashboards to display the data exactly how we need it.
Foraging for Telemetry
What could this look like in practice? Well, let’s take a look at a few examples of where our team helped Cisco customers build custom reporting tools.
While each example below had unique devices and challenges, the general goal was the same: Collect telemetry to use for custom dashboarding, reporting, and/or alerting. In each case we utilized a little bit of custom code to collect metrics from devices & import them into an Influx database. Then, we built dashboards in Grafana to display historical & real-time data in a way that helped address the customer’s unique challenges.
DOM Telemetry Monitoring
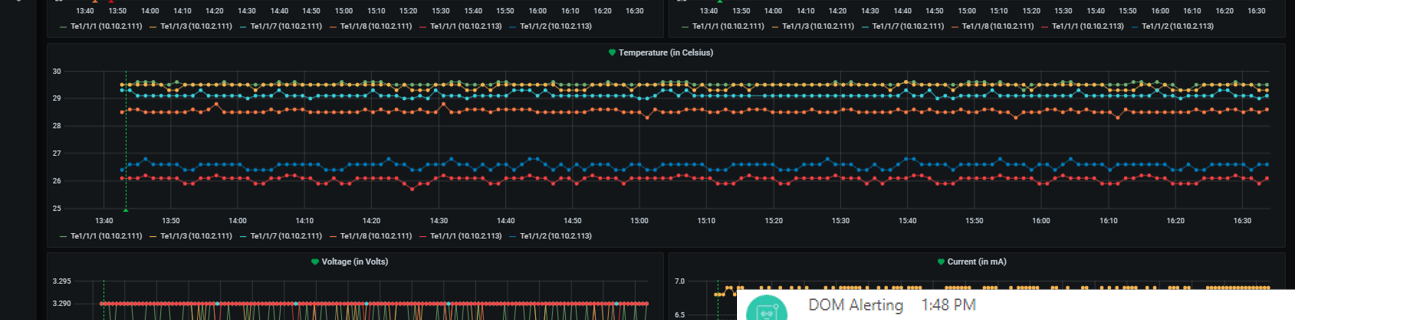
In this example, we worked with a customer who was looking for a better way to proactively monitor their large fiber-based network. Using the Digital Optical Monitoring (DOM) telemetry offered by the fiber transceivers, they could watch for performance trends & get alerted quickly when issues occurred. Our team used a combination of Python & Ansible to periodically query network devices for the optical telemetry. The collected telemetry was used to build a dashboard that showed real-time & trending health statistics. Optionally, the customer could enable Webex push notifications when transceivers exceeded predefined thresholds. This enabled the customer to quickly respond to degrading connection health & address issues before service-impacting outages occurred. Check out sample code & instructions in the DOM Telemetry repo.
Meraki MT Dashboard
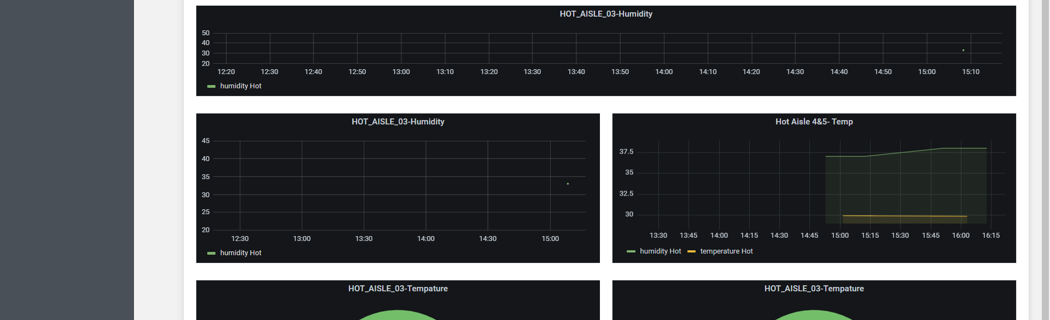
In this example, we had a customer who wanted to keep track of temperature deviations between hot & cold aisles in their data center. The customer had already purchased Meraki MT temperature sensors and deployed them to each rack. However, they wanted a better method of aggregating & visualizing the temperature and humidity data. To meet the customer’s needs, we built a custom flask dashboard that displayed each row of racks & the current temperatures on each sensor. This helped create an easy visualization for customer engineers to locate temperature deviations in each row. This dashboard included aggregate graphs to display historical & trending data for each hot or cold aisle. Check out sample code & instructions in the Meraki MT repo.
PoE Measurement
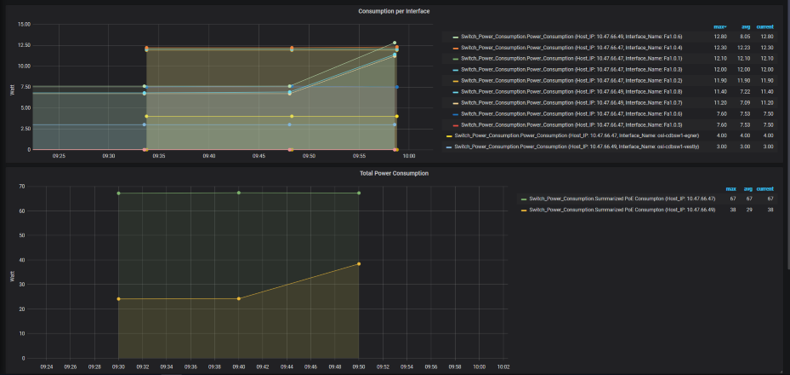
For our final example, we needed to provide a custom system to monitor energy usage within a new commercial building. The building was equipped with smart lighting powered by Cisco’s Catalyst Digital Building (CDB) Switches. Since all of the lights in the building would be powered by Power over Ethernet (PoE), we were able to query the CDB switches to collect power consumption on a per-port basis. Providing this telemetry in a dashboard format allowed the customer to keep track of energy usage within the building, which enabled them to meet their cost & sustainability goals. Check out sample code & instructions in the PoE Measurement repo.
Get sample code & instructions
These days there is more than enough data available to address our monitoring & reporting needs, but we just need to figure out the best way to utilize that information. With a little bit of custom code & a few great open-source tools, it’s easier than ever to build simple monitoring and reporting dashboards.
If you’re interested in learning more about the examples, check out the links below. Each repository contains the sample code & instructions for how to use it in your own network:
About our GVE team
The Global Virtual Engineering (GVE) DevNet team works with Cisco customers to help bring their automation ideas to life. Together with Cisco Account Teams, we find opportunities where customers need a little help getting started with automation or integration projects. We develop simple examples to showcase what is possible with a little bit of custom code. Many of these example projects are published on the GVE DevNet GitHub page and shared with the community.
We’d love to hear what you think.
Ask a question or leave a comment below.
And stay connected with Cisco DevNet on social!
LinkedIn | Twitter @CiscoDevNet | Facebook | YouTube Channel


GREAT stuff Matt!!!!!! Show the power of our products and how programmability can be used to enhance our solutions.