
Yesterday Cisco announced Tetration Analytics, a platform designed to help customers gain complete visibility across their data centers in real time. These posts, Data Center Visibility on a Whole New Scale and A Limitless Time Machine For Your Data Center, provide context and a high level overview of the new platform. This post will provide more insight into the problems Tetration Analytics solves, what it is, and how it works. This is the first of a two part series.
Challenges
Current tools don’t comprehensively address problems like defining app communication and dependencies, providing requisite info needed to move to a zero trust model, or assessing realtime behavior deviation. Nor to they provide complete visibility. Identifying what apps are in the data center, as well as understanding what each of them depend on and talk to is critical, but often times difficult.
These things are important to understand if you are trying move apps from an existing environment to a new one – whether that be a private cloud, e.g. ACI, or a public cloud, or a DR site, or a new data center, etc. They are equally important as you try to build more secure environments and reduce the attack surface.
One customer gave the example of taking down an app to move without clearly understanding all the literally dozens of other apps depending on it. Some broke. This happened even though there was a small army of people sitting in multiple meetings discussing the planned outage. But they still missed things that resulted in unplanned outages.
I spoke with a CTO of a very large organization who told me they spent several years working on understanding these types of things and got maybe 60% through their DC’s. At which point, most of what had been collected was invalid anyhow.
I had another customer conversation where they spent $30 million on a major DC move. About $6 million of the $30 million was spent analyzing and trying to understand what was there so they could move it.
These are big problems. This opaque visibility and dearth of cohesive tools often times results in a sense of ‘crawling in the dark, looking for answers’ (from what I deem to be the DC managers anthem).
Why? Let’s consider a few key reasons:
- Insufficient granularity of realtime telemetry data collected at scale. Existing tools don’t have the ability to see every packet and every flow across the DC infrastructure. Application behaviors are complex and dynamic, resulting in the need for pervasive visibility. However, if you sample, you’re going to miss things. If you don’t sample, you have too much data to get through at today’s DC speeds.
- Lack of ability to analyze data in realtime. Most of today’s tools do not have the ability to analyze large volumes of data in real time and address operational issues comprehensively. As a result, administrators cannot respond to issues in real time and are forced to interpret or project (that’s a polite way of saying “guess”) about relationships, leading to costly and time consuming errors.
- Today’s tools cost too much: The gaps in today’s capabilities cost excessive amounts of time, money and lost opportunity. Some customers spend months, or even years trying to identify what apps they have, how they’re related and what their dependencies are…often times with marginal results.
Solution Overview
Cisco Tetration Analytics is designed to address these, and other, challenges through rich traffic telemetry collection and by performing advanced analytics at datacenter scale. This platform uses an algorithmic approach including unsupervised machine-learning techniques and behavioral analysis, to provide a turnkey solution.
The words in the paragraph above, while accurate, hmm, are a bit foreign sounding to somebody like me that was brought up with concepts like subnet masks, Area 0, route redistribution, and the like. Or maybe the words just have too many syllables for me. In any case, lets unpack what they mean below.
Components
Tetration is comprised of 3 fundamental elements:
- Data Collection
- Analytics Engine
- User Access and Visualization
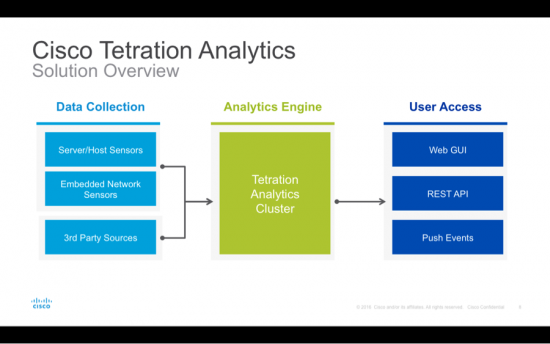
Data Collection
Data is collected with sensors, of which there are basically 2 types:
- Software or Host sensors: These can be installed on any end host (virtualized or bare metal) servers.
- Hardware sensors: These are embedded in Cisco Nexus 92160YC-X, Cisco Nexus 93180YC-EX and Cisco Nexus 93108TC-EX Switches.
Both sensor types reside outside the data path and do not affect application performance. The software sensor uses an average of 0.5% CPU utilization, based on our current experience. The sensor is also configurable, so you can limit the max CPU Utilization.
The hardware sensor adds less than 1% of bandwidth overhead and does not impact the switch CPU at all.
Sensors do not process any information from payloads, and no sampling is performed. Sensors are designed to monitor every packet and every flow. In addition to the sensors, data collection can be done via third-party sources, such as load balancers, DNS server mappings, etc., to collect configuration information.
Analytics Engine:
Data from the sensors is sent to the Tetration Analytics platform, which is the brain that performs all the analysis. This UCS based big data platform processes the information from the sensors and uses unsupervised machine learning, behavior analysis, and intelligent algorithms to provide a turnkey experience for the use cases we’ll discuss tomorrow.
This means that the platform listens and learns what is out there, then identifies who is talking to who, when, where, and for how long. It then builds an understanding of how all these elements behave. Once it has a baseline for their behavior, much can be done. This includes: Replay past events like a DVR for your DC. Alert you to deviations of normal behavior. Tell you what policies will get the objective you want. Predict the impact of what will happen if you change a policy. And much more – all without the need for any fancy data scientists to manage heavy duty big data stuff.
User Access, or Visualization:
Tetration Analytics translates all of this data into useful information through an easy-to-navigate web GUI interface and REST APIs. It also provides a notification interface that northbound systems can subscribe to and receive notifications about traffic flows, policy compliance, etc.
A number of key partnerships will leverage the APIs, complementing the overall functionality of Tetration Analytics and adding value for our joint customers. For more information on these partnerships – who they are and what we’re doing together – please see these quotes from our partners.
Tomorrow, in part 2 of this blog, we’ll cover Use Cases and Benefits, as well as provide additional resources.


Is the Tetration North bound REST API documented & available online?
Hi David, we’re planning to publish the API shortly after FCS, which is scheduled for July 31, 2016.
Hi Craig,
Is this solution suitable for creating an firewall gate for the whole country (something like national FW)..
r/ nam