Delivering high levels of performance for enterprise storage environments is a key objective for CIOs and CTOs, often measured in millions of Input/Output Operations Per Second (IOPS) and microsecond response times.
Production storage environments are extremely complicated, however, so that optimizing performance is akin to solving a multidimensional equation containing multiple variables that constantly interact with each other. Without visibility into those interactions, you’re left with best efforts for optimization. The likely consequence is neither an ability to extract maximum value from the storage investment nor the delivery of maximum performance to the business.
The solution? SAN analytics. IBM c-type SAN Analytics, is the industry’s first and only integrated-by-design architecture, provides deep visibility into SCSI and NVMe traffic at scale. Below, I’ve listed top 10 challenges that can be solved with IBM c-type SAN Analytics.
#1: Find the slowest storage and host ports in the entire network fabric.
Proactively identify storage and host devices (or ports) causing bottlenecks and affecting application performance. Storage admins often look for ports in the path of slow IO transactions, defined as longer IO or Exchange Completion Time (ECT), which is the time to complete read or write transactions.
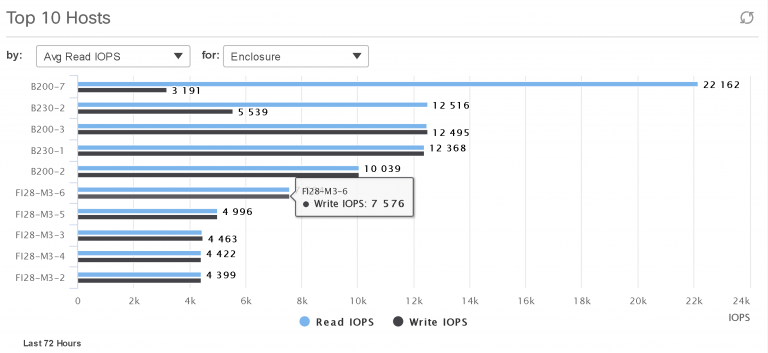
#2: Identify the busiest storage and host ports in the entire network fabric.
You can monitor the busy devices and proactively plan capacity expansion to address the high-usage ports before they affect application performance. Note, knowing a busy device solves a different problem than knowing a slow device.
#3: Discover if poor application performance is due to storage access issues.

If ECT increases, slow storage access may be the cause for application performance degradation. If ECT does not change, you can safely rule out storage access issues and focus your troubleshooting on other infrastructure components.
#4: Determine the cause of storage access issues: storage array, SAN, or host.
If you determine that application performance issues are due to slow storage access, IBM c-type SAN Analytics can pinpoint where this slowdown occurs: within the storage array, in the host, or due to congestion (or slow drain) within the SAN.
#5: Verify multipath (MPIO).
To help optimize storage usage and avoid unplanned downtime, end-to-end paths between a host and storage are proactively monitored to prevent potential multipath issues. IBM c-type SAN Analytics can help you detect if all the paths are not active, or if their utilization is not uniform.
#6: Establish higher levels of visibility between Cisco® UCS Servers and vHBA traffic.

Expedite issue remediation and improve SLAs by getting end-to-end visibility between blade servers, SAN, and storage LUNs. IBM c-type SAN Analytics provides visibility into the vHBA traffic of the Cisco UCS servers by inspecting the frame headers that carry FCID of the server vHBA. Finally, DCNM SAN Insights correlates the initiator FCID to the WWPN of the server vHBA and the host enclosure.
#7: Stop the guesswork by implementing a data-driven storage vMotion.
Use the throughput, IOPS, and other information from IBM c-type SAN Analytics to optimize an application’s underlying infrastructure and make informed, data-driven decisions on moving storage-hungry VMs to lesser-used physical hosts or paths. This helps improve SLAs while reducing overall infrastructure costs.
#8: Verify and optimize the usage of storage array ports.
Confirm uniform usage and obtain detailed metrics at a LUN level to help make informed corrective actions. For example, if one port of a storage array is 70% utilized, while another port is only 30% utilized, you can move the LUN association to better balance the load.
#9: Enable change management and verification.
Hardware and software changes are ongoing in data centers (e.g., replacing faulty SFPs and cables, upgrading HBAs, performing software upgrades, and applying patches). Proper verification of changes can be challenging, due to a lack of end-to-end visibility. End-to-end monitoring via DCNM SAN Insights, run both before and after a change, can be used to prevent unplanned downtime, increasing customer satisfaction.
#10: Obtain automatic baseline and deviations.

Use advanced analytics, end-to-end correlations, and long-term trending to help make operations more proactive and productive. One of the biggest challenges facing storage admins is understanding the difference between good and good enough. As an example, just knowing the absolute value of ECT is of little help. Instead, you can use DCNM SAN Insights to learn the ECT of an IO flow, establish baselines, and calculate deviations automatically from the baseline.
Curious to learn more?
- Watch theCisco Live presentation on DCNM SAN Insights
- Gain a deeper look at enterprise storage infrastructure through an overview of the Cisco SAN Analytics and SAN telematics streaming solution
- Learn more about Cisco SAN Analytics and Cisco storage networks
- View the infographic SAN Analytics: Get Real-time Visibility into NVMe and All Flash Storage
- Learn about IBM Storage Networking c-type family
- To learn more about how Cisco and IBM are working together, please visit cisco.com/go/ibm


CONNECT WITH US