
Network Operations in Enterprises and Service Providers need better visibility into traffic flows for a variety of reasons, including ease of troubleshooting, security, and compliance. Historically, this level of visibility requires leveraging network Test Access Points (TAP) and SPAN (port mirroring) to feed traffic to monitoring and inspection tools. But this approach has drawbacks, including the need for a dedicated port on the monitoring device for every TAP or SPAN destination, making the configuration very expensive.
As a network expands across campus and multiple sites, so does the need to add new monitoring devices, resulting in additional operating complexity and cost. As the traffic in the network increases, these monitoring devices often become bottlenecks because they can only be scaled vertically.
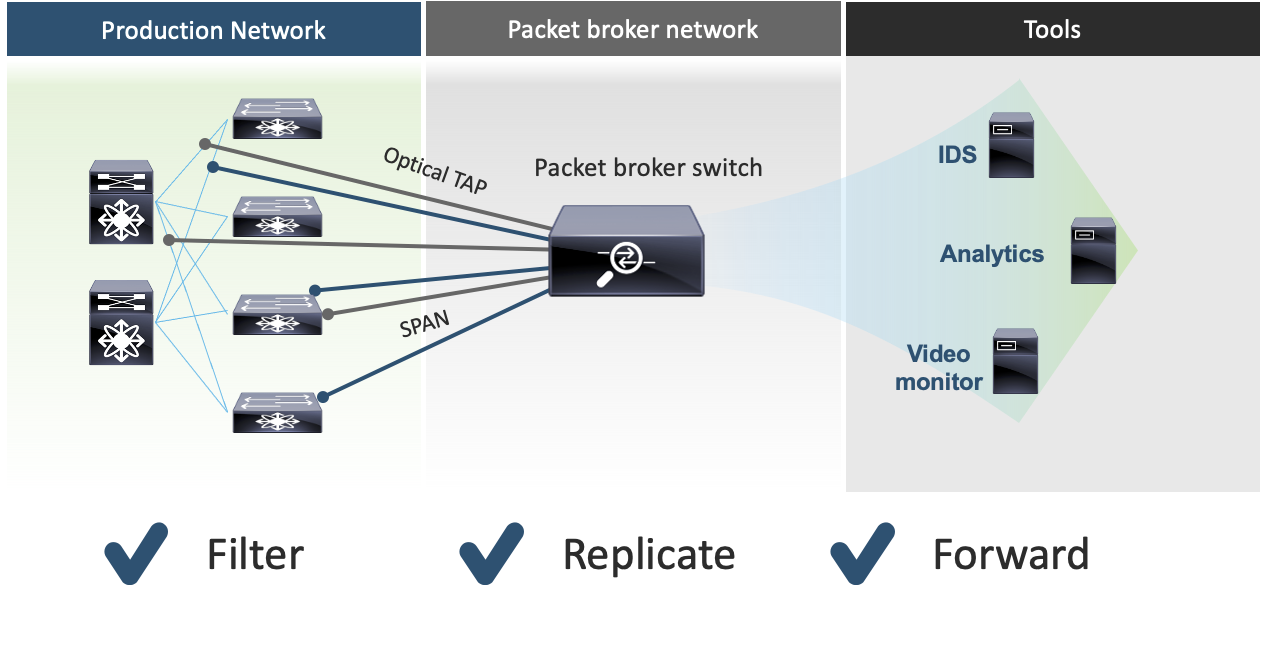
More Efficient Filtering with Packet Brokering Devices
Rather than feeding packets from TAPs and SPAN destination ports to each monitoring tool, NetOps can consolidate all of the flows into a packet brokering device which filters, replicates, and timestamps the packets before they are fed to the monitoring tools. But here again there are drawbacks. Network packet brokers were originally implemented using expensive purpose-built hardware that lacked sufficient port density and throughput of complex networks. In order to provide end-to-end monitoring, NetOps had to deploy multiple purpose-built brokers which significantly increases CapEx.
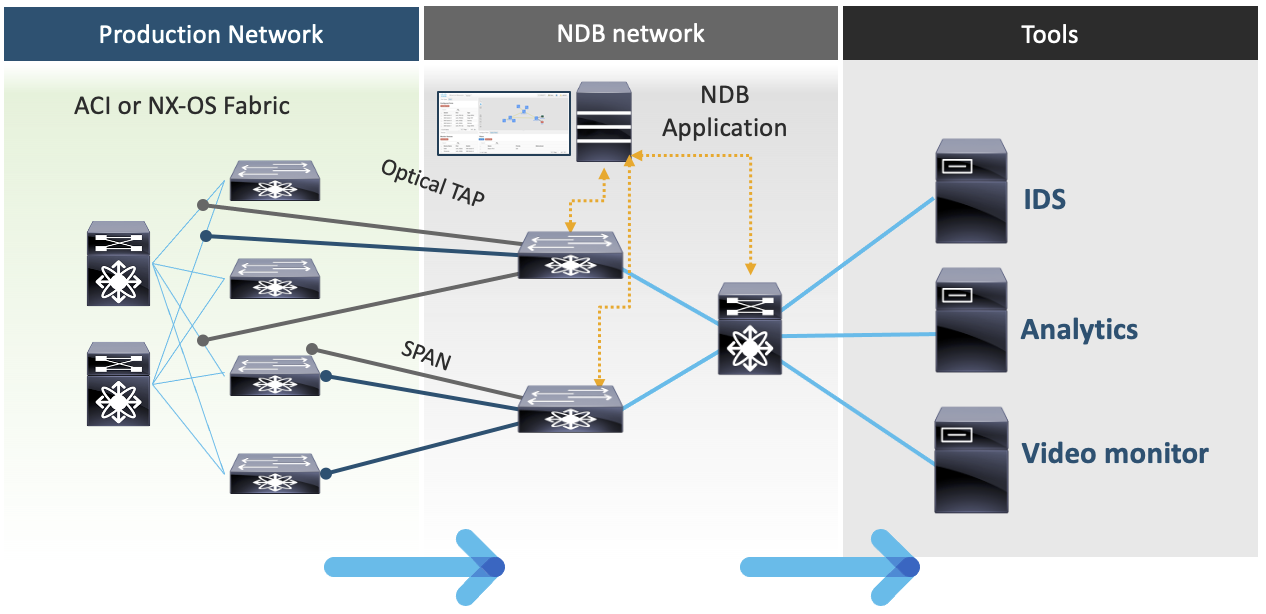
Attaining Deep Traffic Visibility with Cisco Nexus Dashboard Data Broker
The Cisco Nexus Dashboard Data Broker provides a scalable, cost-effective solution for enterprise IT by providing deep visibility into traffic flows. Nexus Dashboard Data Broker replaces the traditional purpose-built network packet broker with high-throughput Nexus 9000/3000 series switches. The Nexus Dashboard Data Broker creates a packet brokering network with a Cisco Nexus switch to monitor and manage a scalable and flexible interconnected network. Cisco Nexus Dashboard Data Broker provides:
- Superior port capabilities and density – 100M, 1G, 10G, 40G, 100G, and 400G
- Granular matching and filtering for traffic based on VLANs, IPs, TCP/IP flags as well as Layer 7 HTTP methods. This also enables operators to choose what traffic is sent to which monitoring appliance for optimal use of the appliance.
- User Defined Filtering to match on any field in the packet header within the first 128 bytes of packet.
- Symmetric Load-Balancing of traffic across monitoring devices while maintaining symmetry for reverse traffic.
- ERSPAN destination monitoring of traffic from networks that are not directly connected.
- Packet truncation and time stamping.
Simplified Management of Packet Matching and Filtering Rules
To simplify creation of packet matching and filtering rules, the Nexus Dashboard Data Broker provides a Graphical User Interface (GUI) as well as Representational State Transfer (REST) APIs. By using the Nexus Dashboard Data Broker, NetOps can automate the creation of the SPAN session on both NX-OS and ACI production fabrics. Then, as the mirrored copy of the traffic is ingested into the Nexus Dashboard Data Broker fabric, the operator can define various actions such as matching and filtering based on VLAN, IPs, or TCP and create load-sharing rules to redirect the traffic across a cluster of monitoring appliances.
The GUI also provides visibility into the Nexus Dashboard Data Broker fabric and enables visualization of end-to-end flow visibility. This includes the interface through which the traffic enters the fabric, all the way to the monitoring device and every network hop in between. The same application can manage multiple independent Nexus Dashboard Data Broker fabrics, providing a single point of access that simplifies management.
Simplify Traffic Monitoring for Security, Compliance, and Troubleshooting
Cisco’s Nexus Dashboard Data Broker—already widely deployed across a variety of industries—provides a flexible and easy-to-use solution that enables organizations to simplify monitoring traffic flows for security, compliance, and troubleshooting. Leveraging the same switching hardware for the brokering network as the production network makes the overall solution less expensive than traditional packet brokering configurations. The Nexus Dashboard Data Broker application is easy to integrate into IT’s existing workflows and third-party monitoring tools.
Here’s what customers who have benefited from Nexus Dashboard Data Broker have to say:
“The greatest benefit for us was that we no longer had to think ‘where are we going to cable those taps and everything?’. This was because the number of ports were no longer a limitation, and the number of switches were no longer a limitation. We could scale out with everything.”
— Thomas Muehlemann, Network Monitoring and Assurance, Swisscom
“The key benefits of Cisco Nexus Dashboard Data Broker are both technical and financial. I can achieve the packet monitoring and analysis needs at a pretty inexpensive cost-per-port as opposed to needing to budget for expensive enterprise purpose-built matrix devices.”
— Nick Wade, Network Engineer, Salt River Project
For more information, please refer to Nexus Dashboard Data Broker web page.


