
Most IT operations folks are familiar with vaguely worded statements like “My application performance is bad,” “The network is slow,” and “Sometimes it works but sometimes it doesn’t.” Often, there’s very little concrete information to work with when attempting to diagnose network performance problems. Any number of possible culprits across a variety of different devices could be wholly or partially contributing to an issue. That leads to the question: “How do you quickly and definitively identify the issue?”
After ruling out the obvious, and some not-so-obvious, signs of a network issue–things like drop counters massively incrementing on an interface, incorrectly applied QoS or security policies, or insidious microbursts–the IT operator is often left with nothing else to do than delve deep into the guts of the network fabric to ensure that all devices and paths between a source and a destination have proper network state, in both the control plane and the data plane.
The Old Way
How does an IT operator approach this problem? The “Old Way” involves a tedious, error-prone, multi-step workflow to validate that the network is behaving as intended.
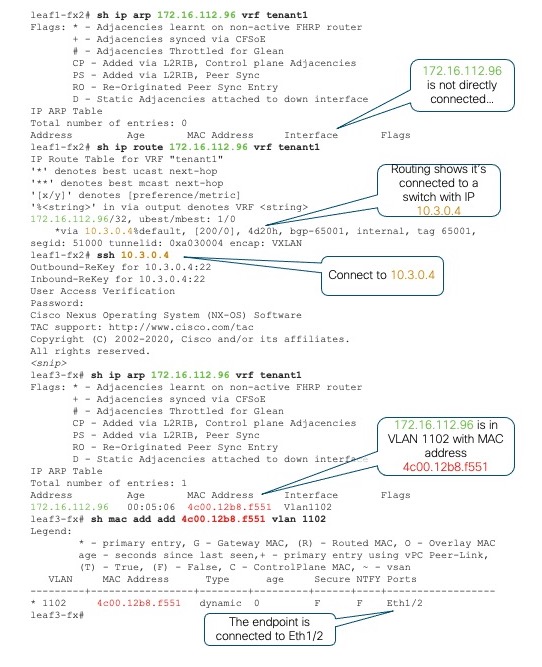
First, the leaf switches that have the problematic source and destination device attached must be identified. In this era of multi-tenancy, virtual machine mobility, and dynamic workload placement, identifying the edge devices is not as straightforward as it might seem. The approach typically involves logging into a random leaf switch and checking the local Address Resolution Protocol (ARP) table to see if the target IP happens to be directly attached in one of the virtual routing and forwarding (VRF) instances active on the switch.
Failing that, we can check the routing table in the appropriate VRF, hopefully identifying which remote switch has the IP attached. Next, login to that switch, check the local ARP table, identify the virtual LAN (VLAN) of the endpoint, and then check the media access control (MAC) table to find the physical interface. Repeat the process for the destination IP address. It’s tedious work, but necessary for ultimately identifying the leaf switches involved.
Figure 1 illustrates the typical workflow for identifying where a given endpoint attaches to the network fabric. In this case, we’re looking for host 172.16.112.96 in VRF “tenant1”.
Once we’ve identified the edge switches with the target endpoints attached, the next task is to identify all the possible paths through the fabric that can be used by those endpoints to communicate and which devices sit in each of those paths. We’ll take a simple spine-leaf topology where each leaf switch connects to four spine switches that provide the leaf-to-leaf interconnection.
If one of our endpoints is on switch “leaf5-ex”, we first identify the destination Virtual Tunnel Endpoint (VTEP) of the other endpoint via “show ip route”, then identify the underlay routing paths available to reach that VTEP. For a simple topology it may be obvious which devices are part of the end-to-end path. In other cases, we can use Cisco Discovery Protocol (CDP) or Link Layer Discovery Protocol (LLDP) neighbor details to identify the device IDs and host names of the transit devices.
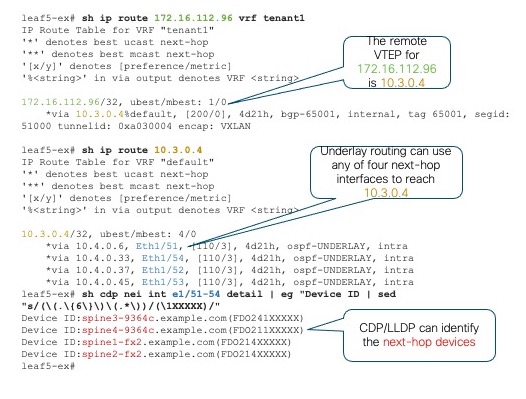
Depending on the topology, we may need to repeat this process multiple times to identify all relevant devices and paths. The goal is to identify to which leaf switches the endpoints are attached, the switches that interconnect them, and the interfaces that make up the available paths.
Next, we must validate that the control plane routing and forwarding state on every device along each of the paths is correct and consistent with the data plane state. We must connect to each device and check a variety of components, which may include routing protocol state, routing information base (RIB) state, spanning-tree state, interface status and health, and so on. We may also need to run one or more consistency checkers, which is logic built into NX-OS to ensure that the forwarding state known to the control plane is consistent with the contents of the Forwarding Information Base (FIB) and other hardware tables programmed into the ASIC hardware. This validation can be time-consuming and error prone. Wouldn’t it be nice if there was an easier way?
The Easy Way
It turns out, there is an easier way! Nexus Dashboard Insights, with its powerful Connectivity Analysis tool, takes the elements of tedium and human error out of the process of validating the end-to-end path between two endpoints in the network fabric. With minimal operator interaction, the Connectivity Analysis tool ensures that all fabric devices have up-to-date diagnostic capabilities, identifies which leaf switches the targeted endpoints are connected to, identifies all possible paths between those endpoints, and then ensures that both control plane and data plane states are valid and consistent to enable end-to-end network connectivity through all relevant devices.
NOTE: As of Nexus Dashboard Insights version 6.0, the Connectivity Analysis tool is available for NX-OS-based fabrics. A planned future release will introduce similar functions for Application Centric Infrastructure (ACI) fabrics as well.
Not only does the Connectivity Analysis tool validate the end-to-end network state, it also generates an intuitive path view showing all network devices in the path and highlighting any issues encountered that could affect successful communication between the target endpoints.
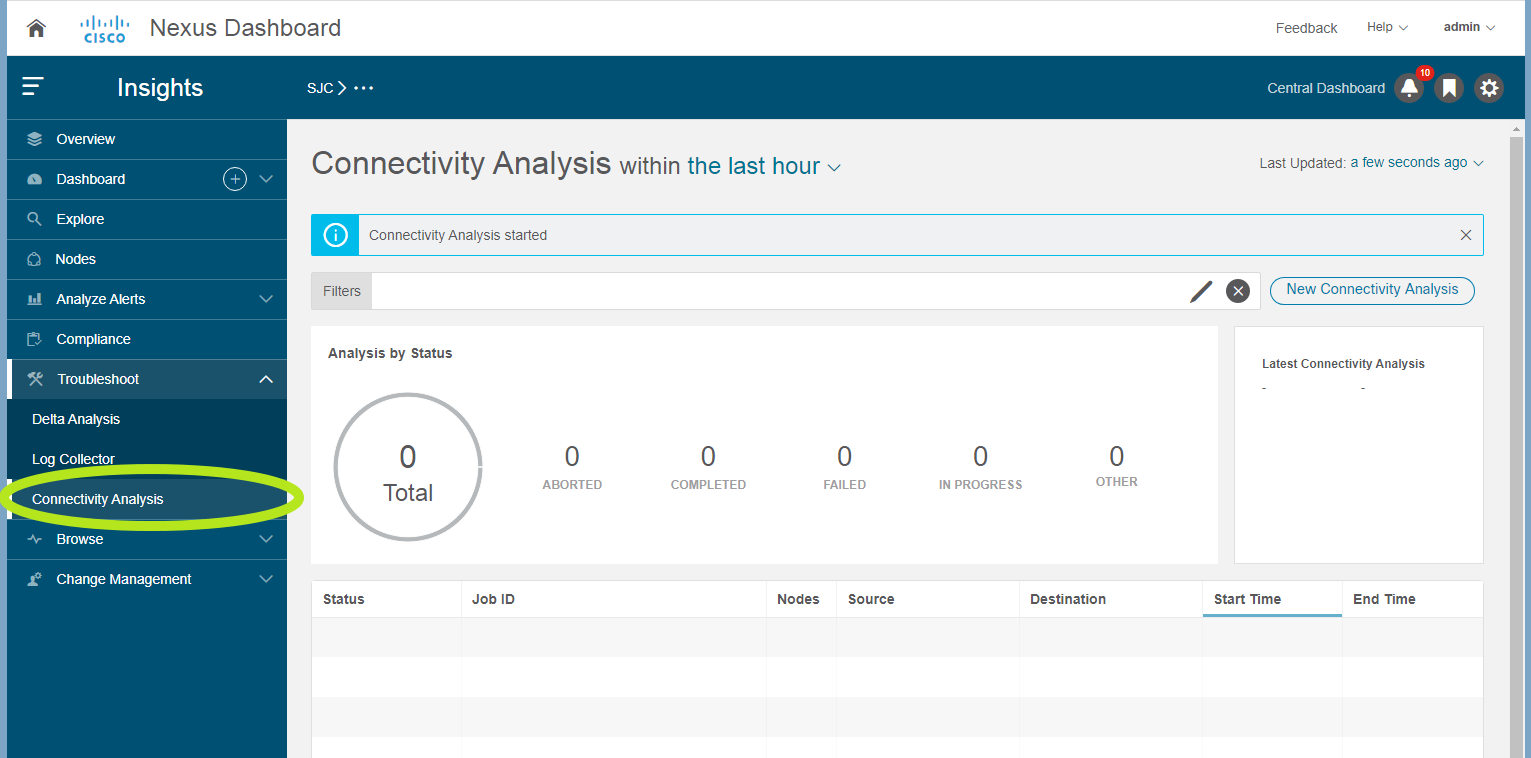
Figure 3 shows the main Connectivity Analysis screen when you open Nexus Dashboard Insights, presenting a summary of all prior analysis jobs with their current state (Completed, Failed, In Progress, etc.) as well as a button for creating a New Connectivity Analysis job. Of course, a Representational State Transfer (RESTful) API is also available for automating creation of new analysis jobs and querying their status.
Taking the earlier example, if we’re debugging an issue between a known source and destination endpoint, we can create a new Connectivity Analysis job and simply plug in the source IP, destination IP, and VRF information. The tool can analyze both Virtual Extensible LAN/Ethernet VPN (VXLAN/EVPN) flows as well as “Classic” Layer 2 or Layer 3 flows and provides an option to run the analysis in Quick mode or Full mode. Figure 4 shows the Analyze Connectivity screen where you enter the required information and control the various job options.
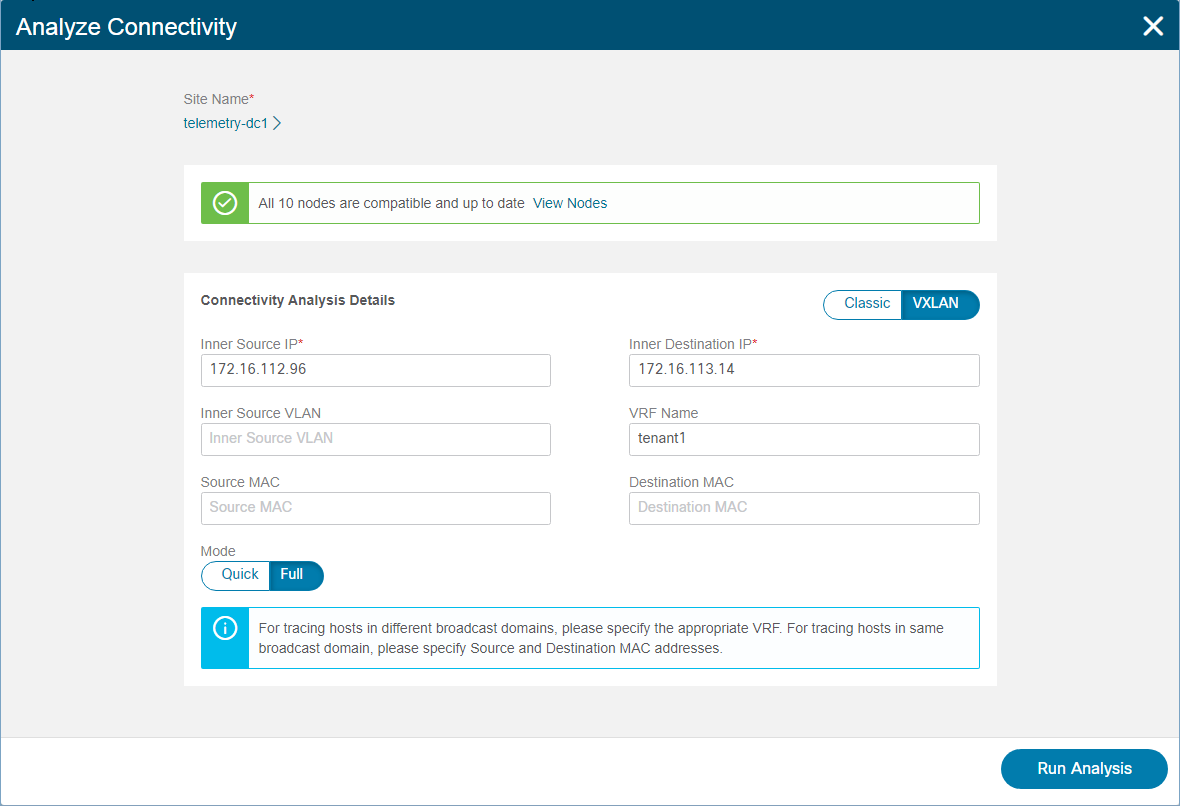
In Quick mode, the Connectivity Analysis tool simply validates the basic control plane, forwarding health on relevant devices, including all overlay and underlay routes and interfaces, while also generating a visualization of the path topology between source and destination. In Full mode, multiple additional checks are performed, including a complete analysis of consistency between software and hardware forwarding state in all relevant forwarding tables.
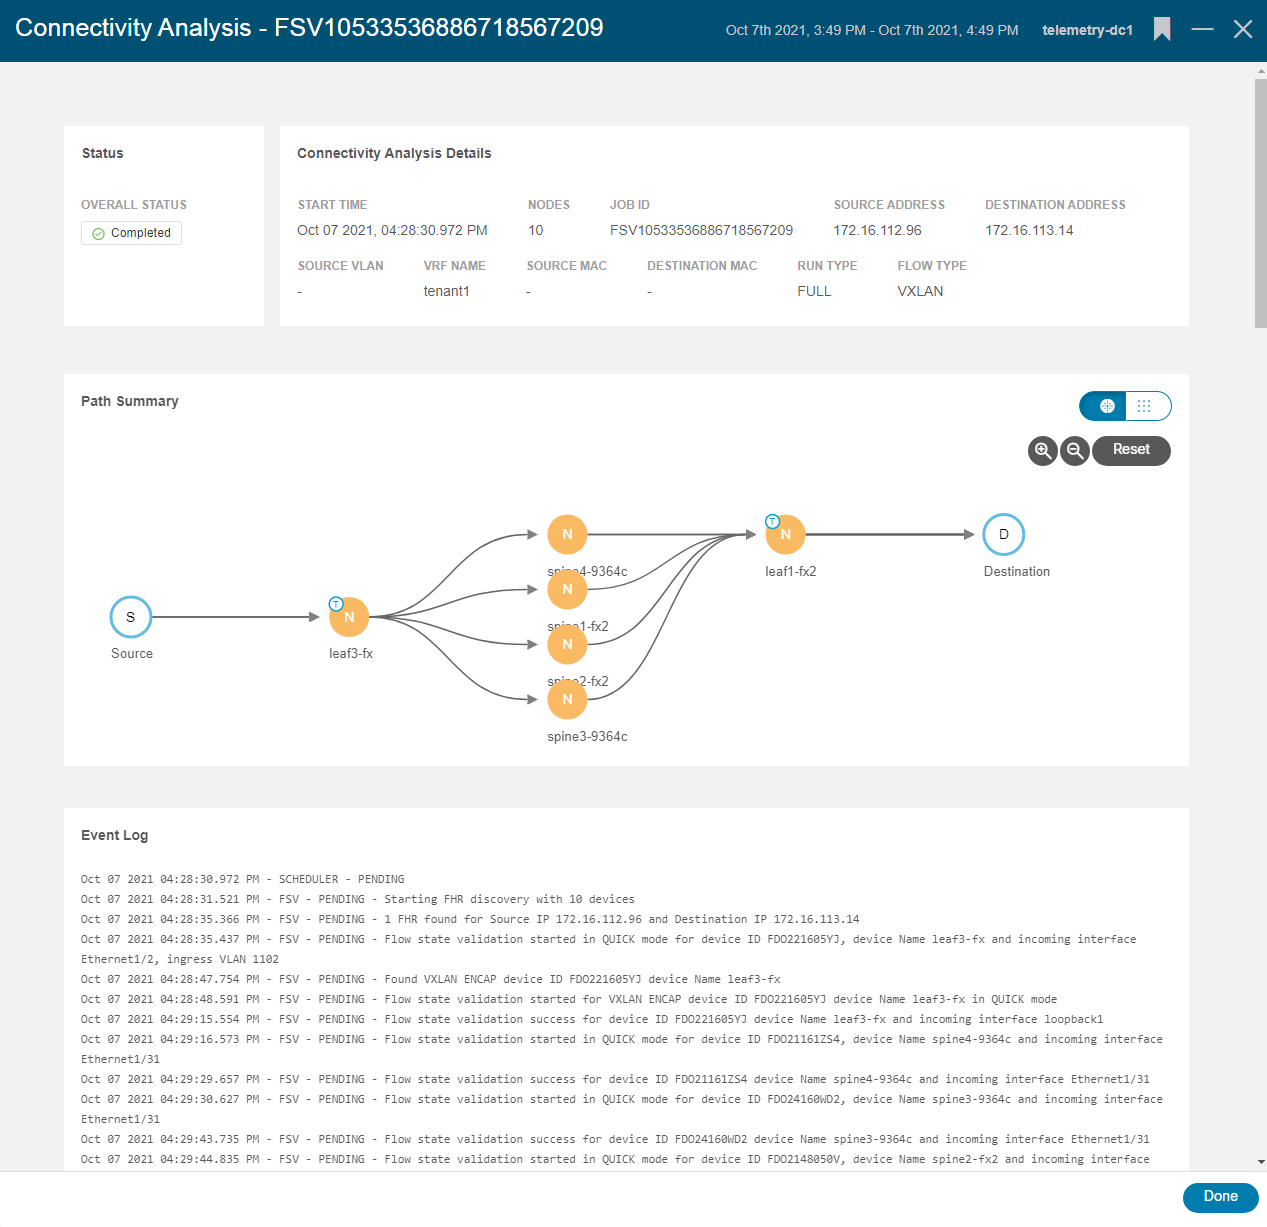
Figure 5 shows the completed job summary, the topological view of all the network devices and paths between the source and destination, and a full Event Log with details of the job.
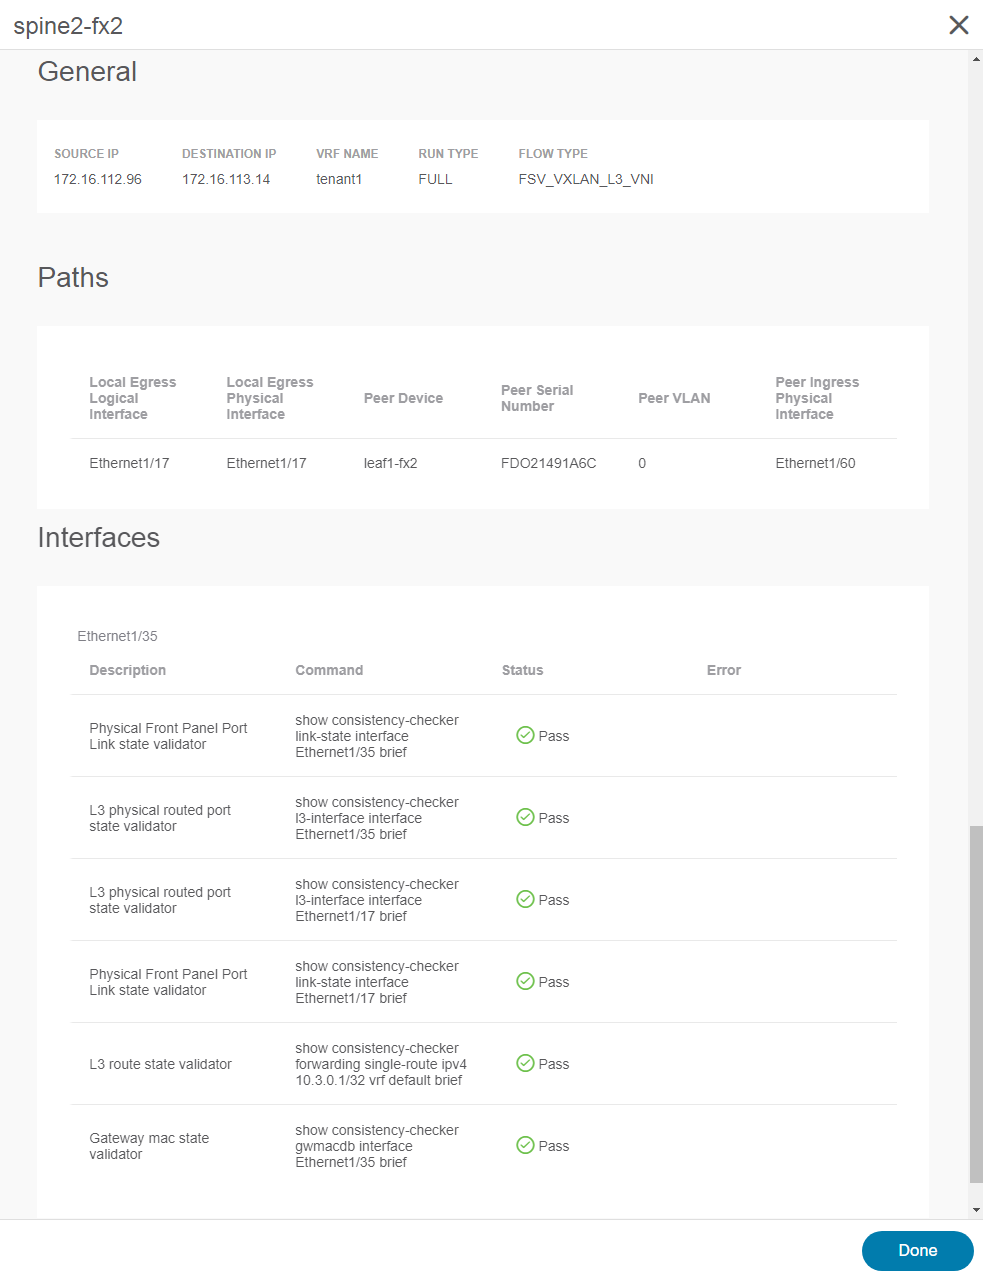
Double-clicking any network node opens details for that device. Figure 6 shows the detail view (in this case for the device “spine2-fx2”), including summary data, path information, and detailed interface information for the relevant interfaces, with a description and status of each validation check performed as part of the analysis.
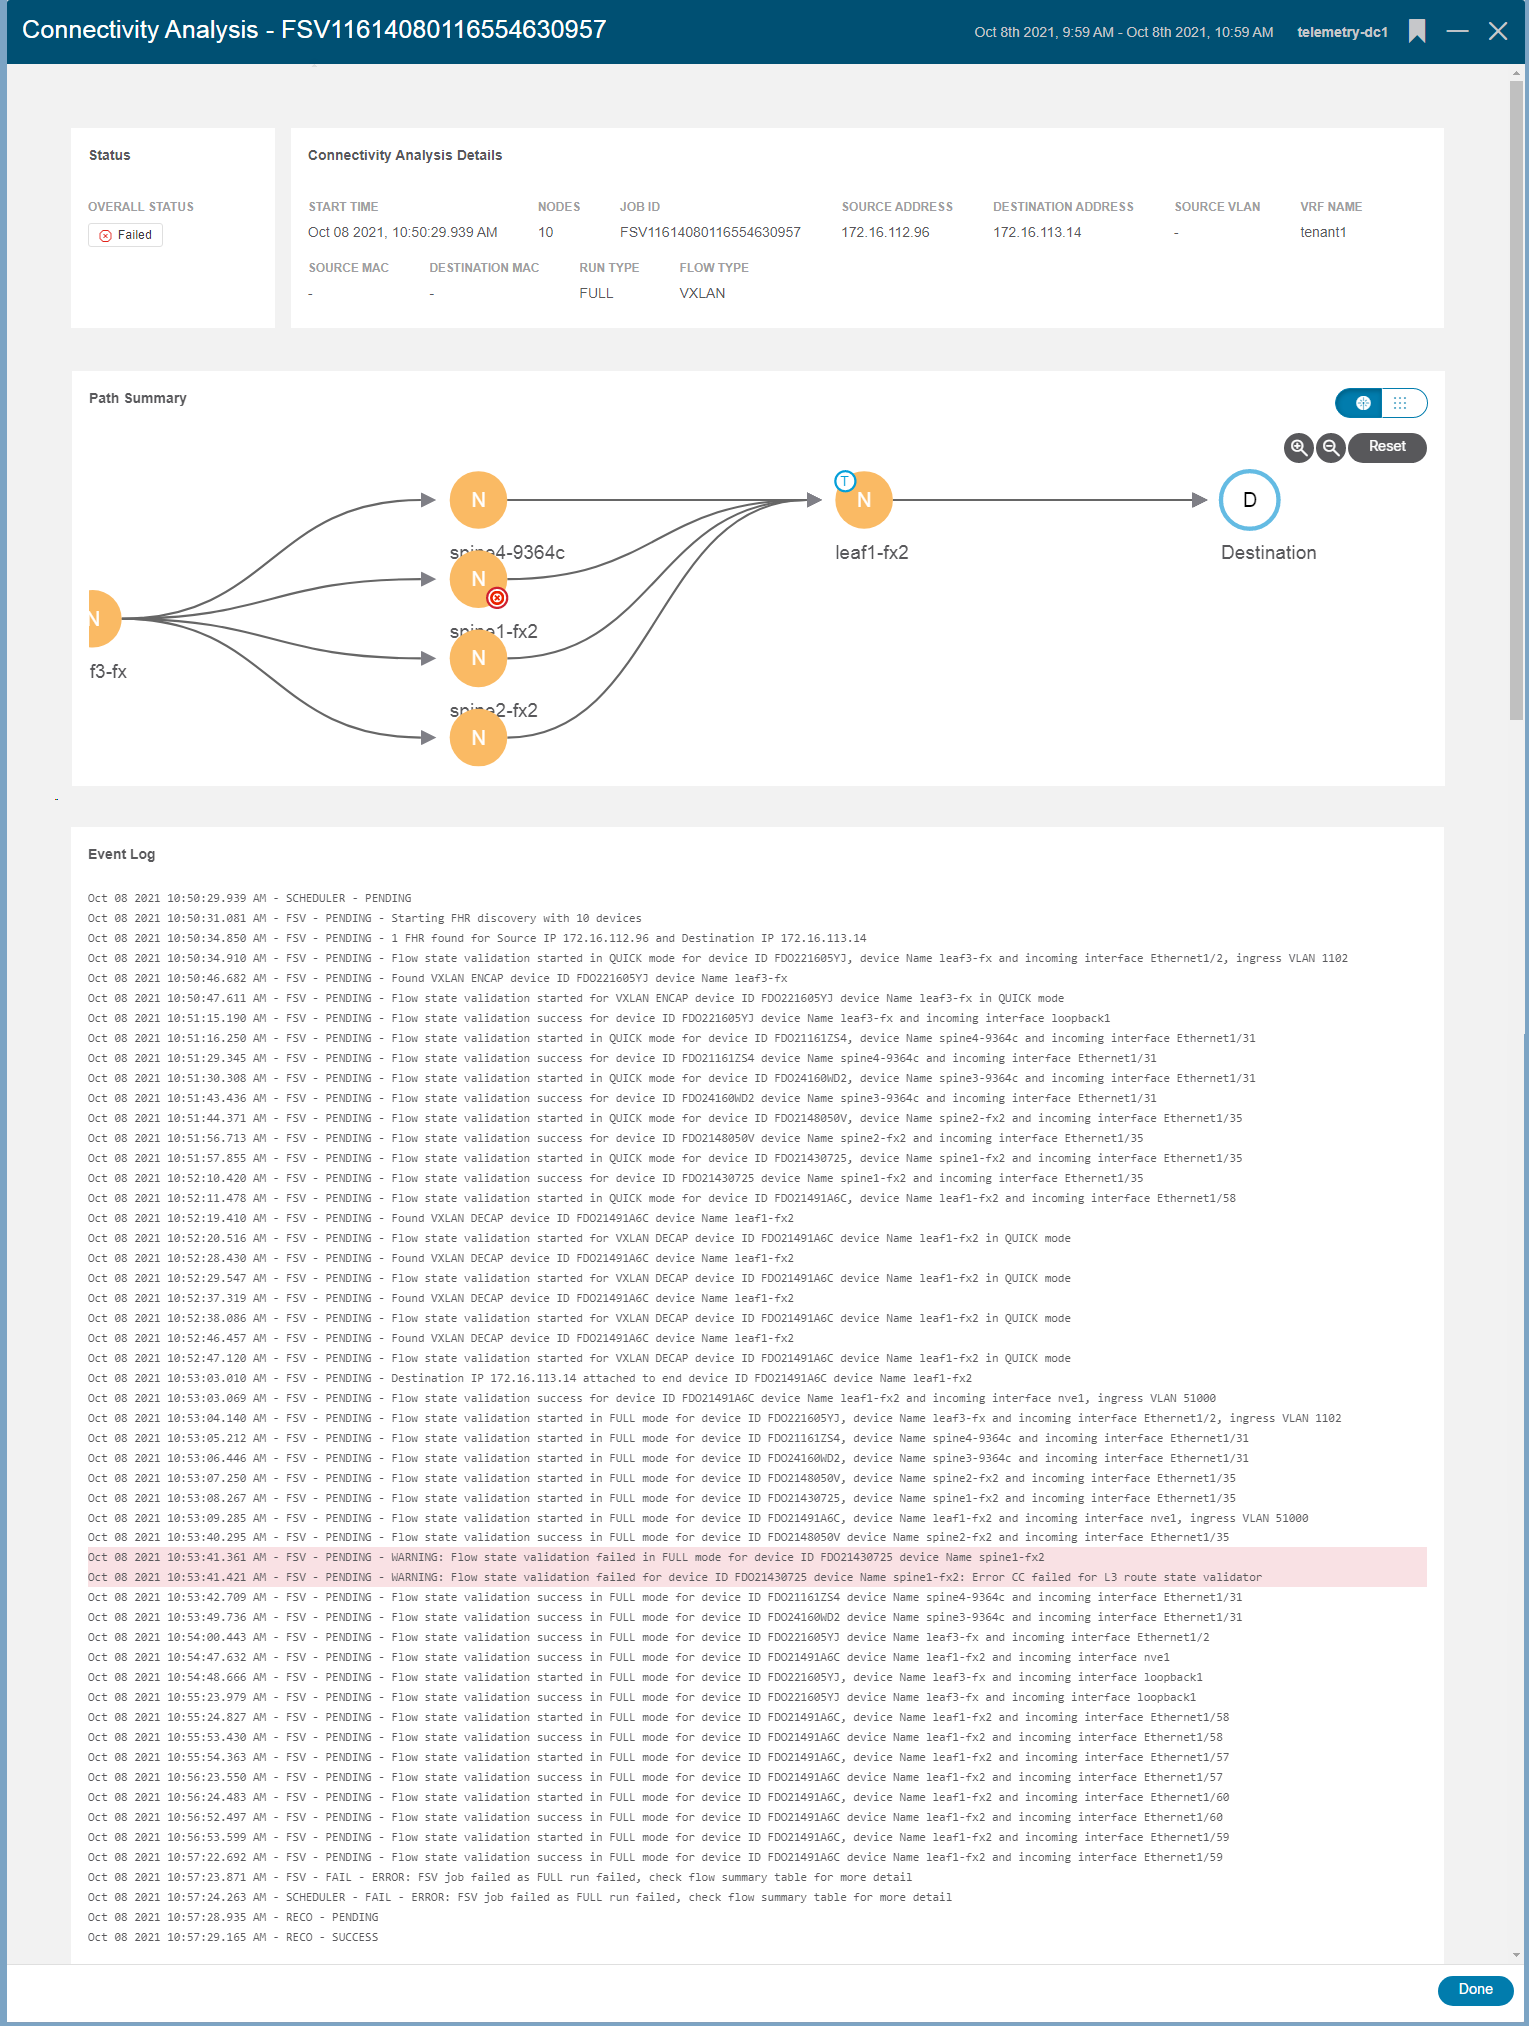
While the examples above uncovered no problems, if a job encounters an issue on one or more nodes, the tool shows all the details of the failure and impacted devices. For example, Figure 7 shows a failed job where an inconsistency was discovered between the software state and the hardware programming on a spine node.
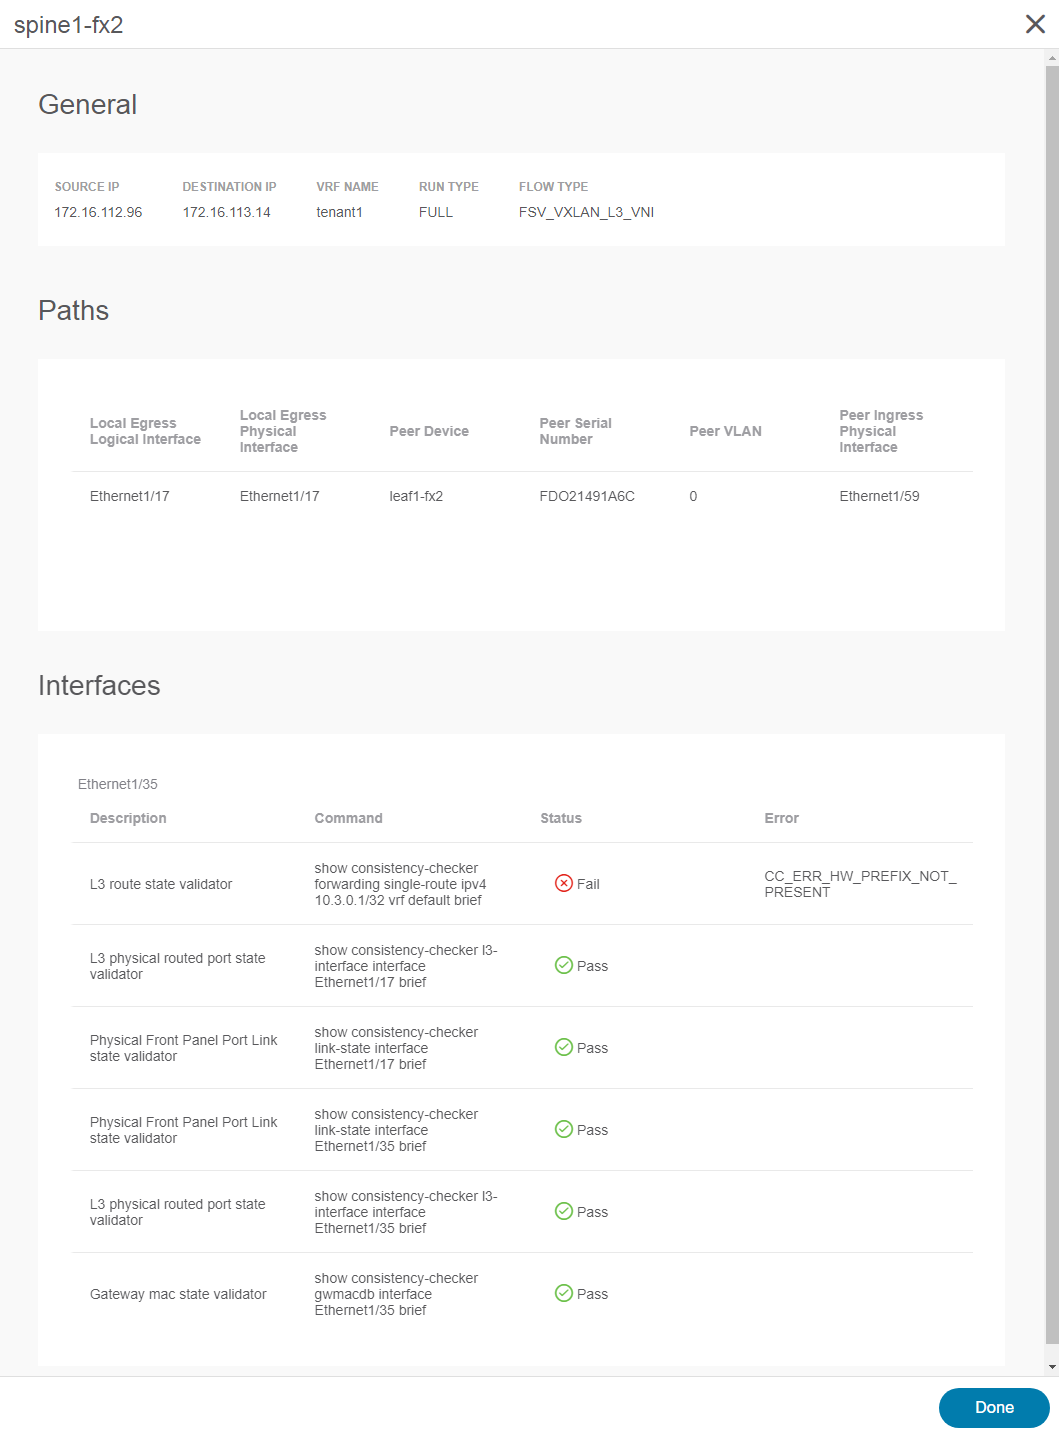
Double-clicking on the failed node (spine1-fx2) reveals the cause of the failure (as shown in Figure 8). A control-plane route was not programmed into the hardware correctly, resulting in an inconsistency. Since the failure is on a spine node, such a programming failure can result in sporadic issues. For flows that hash to other spine nodes, performance is not impacted, but any flows hashing to the mis-programmed spine could be black-holed.
Uncovering such situations can vastly reduce the time required to conduct root cause analysis for forwarding issues in a large fabric. With the option in Nexus Dashboard Insights to collect detailed technical support data from the fabric and upload it to Cisco with just a few clicks, triaging issues locally or with Cisco TAC and driving them to resolution becomes considerably less time-consuming and work intensive.
Key Takeaways
The Connectivity Analysis tool provided by Nexus Dashboard Insights delivers a new level of simplicity and efficiency to the traditionally error-prone and time-consuming task of validating the end-to-end path between endpoints experiencing performance issues or packet loss. With just a few key pieces of information, the Connectivity Analysis tool does all the heavy lifting for you: identifying the leaf switches to which those endpoints attach, discovering all the possible paths between those endpoints through the fabric, and validating the health and consistency of each device and path involved.
Armed with the resulting data, IT operators can either rapidly prove that the network is “innocent” and that the problem likely lies with the host or application or, if a problem does exist in the network, identify the exact nature of the problem and the devices involved. With the additional capability in Nexus Dashboard Insights to easily collect logs and other technical support data and upload it to Cisco via the Cisco Intersight Cloud, tracking down problems in the network and driving them to rapid resolution is easier than ever before!
Resources:
You can find more information about the technologies discussed in this blog at:


