
OpenStack summit Vancouver has arrived and I for one can’t wait to see how much OpenStack has progressed from Juno to Kilo. I expect to see even more momentum with new companies being added to the OpenStack community, continuing to drive the industry acceptance momentum of OpenStack. While a lot of good stuff is happening from a functionality (features) and new projects standpoint, being able to systematically measure performance across the major components still remains largely a work in progress. While Nova (Compute) and Swift (Object Storage) continue to mature rapidly with good work being done by many in the OpenStack community around performance measurement, Neutron (Networking) continues to lag.
Prior to the Juno summit in Paris last November, there was intent in the OpenStack community to move away from Nova networking onto Neutron where there is significantly more functionality and scale to be had. But there are many challenges that are preventing this migration from happening. Primary among those challenges is the inability to easily measure performance on Neutron to ensure that there isn’t significant performance degradation as a result of the move from Nova networking to Neutron. Cisco is proactively addressing the gap of performance measurement on Neutron by releasing in Stackforge an open source data plane performance measurement tool called VMTP (VM Throughput Performance). It is heartening to see that others in the community are also providing tools for data plane measurement such as the recently released “shaker”.
VMTP addresses the need for a quick, simple and automatable way to get VM-level or host-level single-flow throughput and latency numbers from any OpenStack cloud, while also taking into account various Neutron topologies. VMTP can also easily check whether certain OpenStack configuration options, Neutron plug-ins perform to expectation or if there is any data path impact for upgrading to a different OpenStack release.
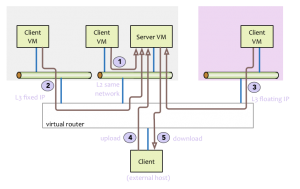
VMTP is a small python application that will automatically perform ping connectivity, round trip time measurement (latency) and TCP/UDP throughput measurement for the following East/West flows on any OpenStack deployment:
- VM to VM same network (private fixed IP, flow #1)
- VM to VM different network using fixed IP (same as intra-tenant L3 fixed IP, flow #2)
- VM to VM different network using floating IP and NAT (same as floating IP inter-tenant L3, flow #3)
In addition VMTP can also test for the following traffic scenarios
- When an external Linux host is available for testing North/South flows:
- External host/VM download and upload throughput/latency (L3/floating IP, flow #4 and #5)
- Optionally, when SSH login to any Linux host (native or virtual) is available:
- Host to host process-level throughput/latency (intra-node and inter-node)
VMTP can also extract automatically CPU usage from all native hosts in the cloud during the throughput tests, provided the Ganglia monitoring service (gmond) is installed and enabled on those hosts.
For VM-related flows, VMTP will automatically create the necessary OpenStack resources (router, networks, subnets, key pairs, security groups, test VMs) using the public OpenStack API, install the test tools then orchestrate them to gather the throughput measurements then cleanup all related resources before exiting. VMTP has been architected to run independently of Heat as we’ve seen that most deployments in the field don’t have Heat also installed.
VMTP measures true north/south traffic via a client app that run outside the cloud. Additional benefits of using VMTP are:
- A hook to Ganglia monitoring to capture host level system metrics during test
- Flow measurement chaining which results in faster runs (e.g. VMTP chains all client VM positions for different flows with the same server VM, which you can’t do with Heat. With Heat you need to tear down and rebuild the setup/server for each flow)
- Results stored directly in MongoDB
- Auto extraction of OpenStack versions, encapsulation and L2 agent types and versions
- Select special network interfaces (useful for VMs attached to multiple networks)
- SR-IOV and IPv6 support
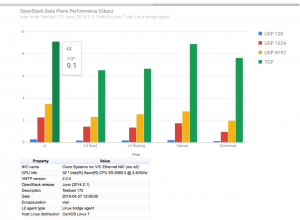
- Detailed online documentation @ http://vmtp.readthedocs.org/en/latest/Finally VMTP also supports a quick way of creating charts from multiple run JSON results so you can easily view and consume the results of multiple runs. This new feature (genchart.py) takes one or more VMTP JSON files as input and generates a static HTML file. The –browser option allows the tool to directly open the generated HTML file in the user’s default browser. There is no need for any additional HTTP server since the html file is self-contained and the browser will automatically load the required JavaScript libraries.
I hope you enjoyed learning about what the VMTP tool can offer and hope you join in making it even better by contributing to the code at: http://vmtp.readthedocs.org/en/latest/contributing.html#contribute-to-vmtp


