
Previous blogs in this series, both by Splunk and Cisco, detail how Cisco Identity Services Engine (ISE) can be used to drive enhanced event visibility in Splunk.
Splunk is a machine data platform that allows you to search, report, alert, and visualize any data that it ingests. Cisco ISE brings an added dimension to analyzing all this data; it attaches key contextual data (for example, username, location, network policy status) to events and data analyzed by Splunk. The Splunk for ISE app, a free download from Splunk, comes with a number of built-in dashboards to correlate this machine data with user information and create customizable dashboards and reports.
However, this integration doesn’t just create pretty dashboards – it turns event analysis into action.
Together Splunk and Cisco ISE enable users to move quickly from suspicion that an event that needs further investigation may have taken place, to conviction that this event has occurred, to remediation action that can prevent further damage from the event. Threat event results from Splunk can be distilled into mitigation action by using Cisco ISE to undertake quarantine or access-block actions on users and devices. Improved efficiency in determining which events are significant, detecting them quickly, and remediating them effectively, enables better allocation of IT resources and can also help reduce the impact of a malicious event. It also inhibits the ability of the infected endpoint to spread malware laterally across the network.
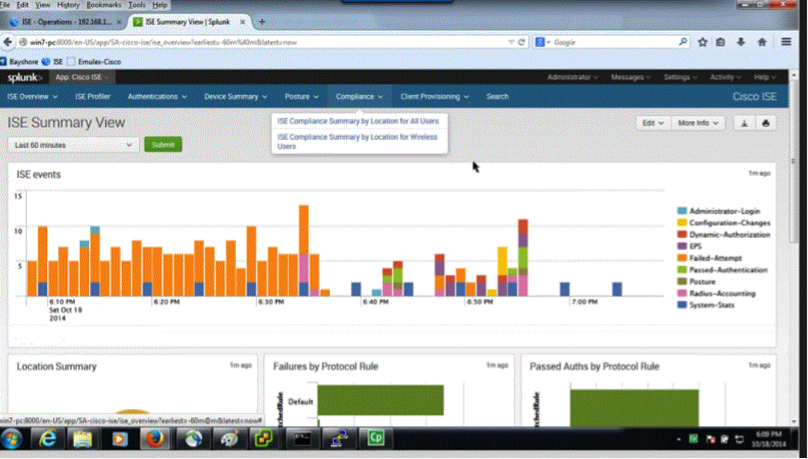
To illustrate an example of this process, let’s look at the Splunk for Cisco ISE app compliance dashboard summary below. The syslog information from Cisco ISE would have been sent over to Splunk to create this dashboard showing that users are compliant, in this case, because they have the Windows Defender service installed on their devices.
However, if a user had the Windows Defender service disabled, or it had been compromised, the user would fail a posture check when trying to authenticate to the network. This posture check failure would then trigger a syslog event from Cisco ISE to Splunk, and the dashboard in Splunk would change to indicate that there is a noncompliant user. This is reflected in the Splunk dashboard below.
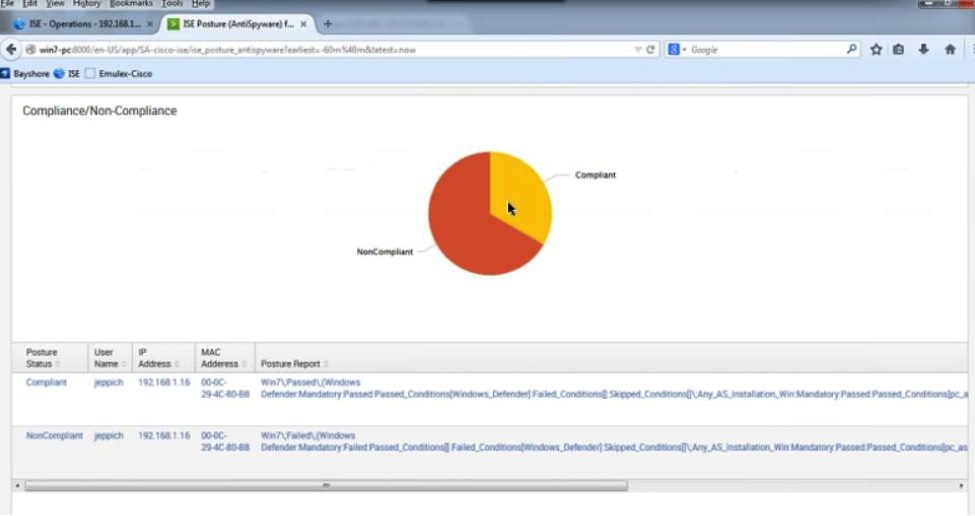
The administrator can then click on the noncompliant posture/status within this dashboard and further investigate the noncompliant endpoint. The administrator would be able to see the event in more detail, get the MAC address, and induce a workflow action for Cisco ISE to quarantine that endpoint so that further investigation could be done before allowing the endpoint back online. This endpoint quarantine is reflected in the dashboard below.
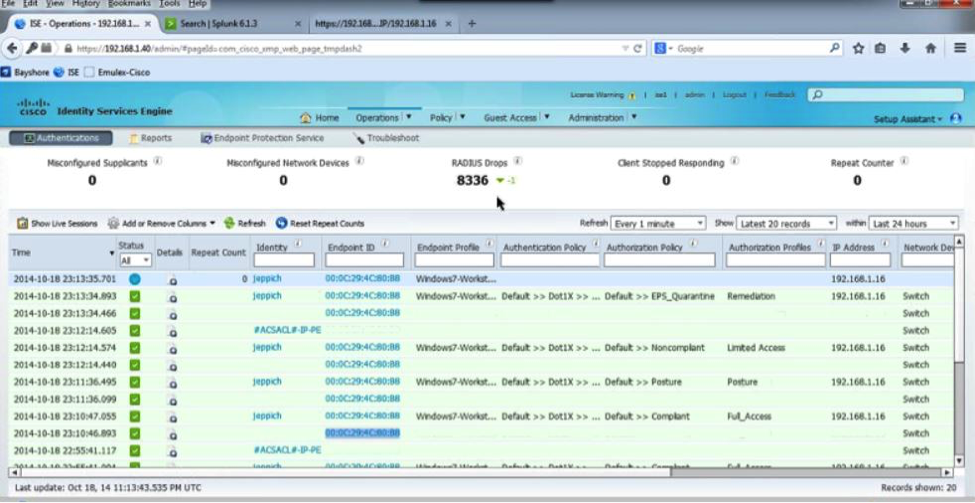
The administrator used these dashboards to easily identify an endpoint that needed further investigation and to quarantine and redirect that user, preventing the user from gaining access to network resources and potentially spreading malware across the network. If you are attending Cisco Live Milan, stop by the Cisco Security and Splunk booths at the World of Solutions to see this Splunk and ISE demo live and hear more about how together we turn event analysis into action.


Great article. Wish i red it few months ago when i was having issues synchronizing reports from ISE and Spunk and presenting them to upper management.