 Guest Author: Venugopal Sandepudi, Technology Officer, HCL
The solution presented in this article is a winner of the 2018 Cisco & Google Cloud Challenge.
Media and Telecom service providers serve millions of customers, and it is a challenge to monitor and assure that customers have a satisfactory experience with the services. Service providers incur high operation costs through customer support and truck rolls. Reactive customer support often causes customer dissatisfaction resulting in churn and revenue loss. Large volume and variety of data (network, CPE, billing, customer issues etc.) is maintained across multiple systems but is underutilized to add value to business. Different business units work in silos and non-availability of integrated customer profile leads to half-matured marketing efforts, unsatisfactory customer experience and loss of business opportunities. Common roadblocks for business improvement include:
- Lack of consolidated data & accurate insights
- Extended cycle time to process data and delay in access to insights
- Dependency on legacy systems to process data
 Barriers to business improvement
A container-based, hybrid cloud solution
A container-based hybrid cloud analytics solution that will help service providers to understand their customers better. It will provide a unified view about end customers and help improve the services and grow their business.
 Inputs to gain customer insights
POC scope
Customer churn analysis and prediction
- Aggregate data from different data sources (billing, customer support, service usage, CPE telemetry etc.), create an integrated view of customer data and analyze churn
- Implement a simple churn prediction model using hybrid cloud service
Tools and services used
- Cisco Container Platform for CI/CD and management of micro services
- GCP Pub/Sub for data aggregation
- GCP Datalab for data exploration
- GCP Dataflow for stream and batch processing of data
- GCP BigQuery for analysis and BigQuery ML for churn prediction
Solutions architecture
 Solution diagram
Model training and serving with Google Cloud Platform:
 Model Prediction Data Flow
Overview of steps involved to develop the POC
- Preliminary analysis on data consolidated across all (US) regions is performed, for example, Customer Sentiment analysis. Once this data is ready with all the feature labeling, etc, Cisco Container Platform (CCP) and Google Cloud Platform (GCP) are leveraged for gaining meaningful insights about this data.
- Service catalogue is installed on the master node of the CCP cluster. It will provision and bind service instances using registered service broker. Custom application will leverage these service bindings and enable true hybrid cloud use cases.
- In the CCP platform, using the Pub/Sub application, Media telecom customer data gets posted to GCP Pub/Sub.
- Once data gets published to GCP Pub/Sub topics from periodical batch program, published data object will be consumed through Cloud data flow Job
- Cloud Dataflow allows user to create and run a job by choosing google predefined dynamic template Pub/Sub to big query dynamic templates which initialize pipeline implicitly to consume data from topics and ingest into appropriate Big Query data set configured while creating Dataflow.
- Once Dataflow predefined template Job gets started, it begins consumption of data object from input topics which get ingested into BigQuery table dynamically as a pipeline. This table data is then explored using Datalab, and required data pre-processing steps — such as removing null values, scaling features, finding correlation among features, and so on — are performed (please see the Model prediction data flow diagram above). This data is then returned back to BigQuery for ML modeling.
- ML model built using BigQuery will be used for prediction of Customer churn for subsequent data received.
- This processed churn data is retrieved using service broker to CCP and later consumed by UI
Dashboard
- From the Solution dashboard (see sample screen shot shown below) service providers can view the forecasted churn based on region, service, and reason. Customer reported issues, and the services currently being used by the customers can also be visualized.
- Solution dashboard allows service providers to take quick action. For instance, improving the wireless service or 4K streaming service, thereby preventing customer churn.
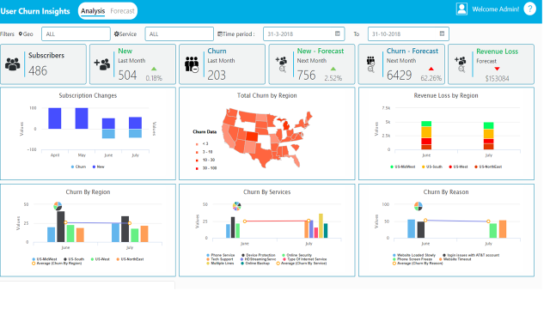 Customer Insights Dashboard
Solution Demo Video


CONNECT WITH US