What Are Microbursts and Why Do They Matter?
Ever wondered why a switch interface shows an average utilization of well below wire rate, and yet egress discards are incrementing? Most likely, that interface is experiencing microbursts. Often, when multiple input interfaces simultaneously receive traffic destined to a single egress interface – a so-called “incast” traffic pattern – no problem arises because the instantaneous receive rate is low enough that the output interface can handle the load.
The term “microburst” refers to the same situation, but where the receive rate of those interfaces in aggregate exceeds the wire rate of the output interface for some time. In this case, the excess traffic must be buffered. If enough such traffic arrives simultaneously, the buffer on the output interface can fill and potentially overflow, resulting in discards. Figure 1 illustrates the microburst concept.

In the example shown in Figure 1, three interfaces simultaneously receive a series of back-to-back packets with a minimum inter-packet gap (IPG). The destination must transmit those packets but can only transmit at the maximum rate of the output interface. In this case, all four interfaces are the same speed, so the transmit interface is forced to buffer the excess traffic. If the burst is short-lived, the transmit interface will eventually empty the buffer and only a small latency penalty is paid. But if these traffic bursts last long enough, the buffer can overflow, resulting in egress discards. While at times packet drops are benign or at least productive – for example, randomly dropping frames to prevent congestion buildup while avoiding TCP window synchronization – they can also negatively impact application performance, not to mention simply causing concern among network operations staff.
If egress interface discards are incrementing, how can it be confirmed that microbursts are indeed occurring, and if so, how often and how long-lived they are? Is congestion only occasional, or is a given interface perennially congested, which might warrant workload redistribution, configuration changes, or other action? Traditional methods such as monitoring interface counters do not offer the needed visibility – such counters are typically read by software at relatively long intervals (often 10 seconds or more) and therefore tend to “smooth out” bursty traffic patterns. That’s where the Cisco Nexus 9000 series Data Center switches come into the picture.
What Is Hardware-Based Microburst Detection and How Does It Work?
Cisco Nexus 9000 series Data Center switches, including both fixed-form-factor Nexus 9300-EX/FX/FX2/FX3/GX (as well as the 9364C and 9332C) and modular Nexus 9500-EX/FX/GX platforms, provide advanced hardware capabilities that make detecting and measuring microbursts easy. Based on custom Cisco silicon known as the Cloud Scale ASIC family, these switches provide granular per-interface per-queue monitoring for hard-to-identify traffic microbursts, for both unicast and multicast traffic.
Each queue is instrumented with trigger-based microburst measurement capabilities. When the buffer utilization for a monitored queue crosses a configurable “rising” threshold, the silicon captures the exact moment that threshold was reached using a nanosecond granularity timestamp; as the buffer continues to fill, the “peak” depth of that queue is recorded along with another timestamp; and finally, as the queue drains, a third and final timestamp is recorded as the queue drops below a “falling” threshold. The result is a series of raw records that looks like the output in Figure 2.

Consuming Microburst Data for Analysis
Now that we’re able to detect when, how often, and how severe microburst activity is, what can we do with that data? Of course, you can always observe the burst data directly on the switch (running NX-OS software), using the “show queuing burst-detect” command. This option is the most basic and may suffice for certain situations – a quick spot check of activity on an interface or queue for example – but in most cases, you’ll want to retrieve the data from the switch for consumption and analysis by other systems.
The powerful streaming telemetry capability in NX-OS software offers an excellent option for getting microburst data off of the switching infrastructure and into other systems for further analysis, trending, correlation, and visualization. NX-OS software streams telemetry data using JSON or Google Protocol Buffer (GPB) encoding over a variety of transport options, allowing platforms provided by Cisco, third parties, or developed directly by IT to easily ingest and parse the data generated by the switching infrastructure.
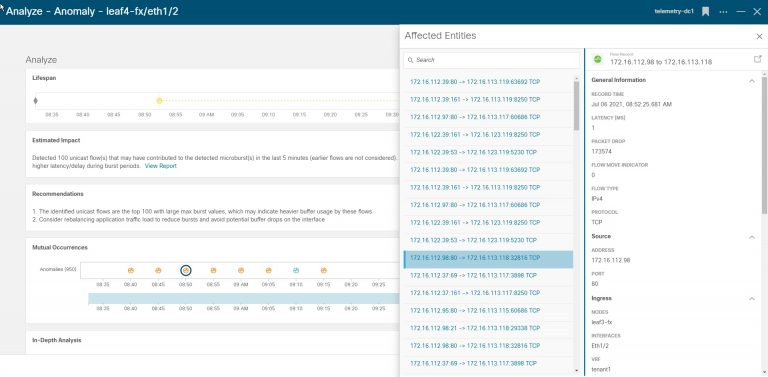
The Cisco Nexus Dashboard Insights application easily handles configuration, consumption, and analysis of microburst data from one or more switch fabrics—both NX-OS based as well as ACI based—quickly alerting network operators of excessive microburst activity across the network. Figure 3 shows an example of a microburst-related anomaly generated by Nexus Dashboard Insights upon observing multiple microburst events occurring on a given interface over a short period of time.

As shown in Figure 3, Nexus Dashboard Insights not only identifies the device, interface, and queue experiencing microbursts, but also correlates those burst events to monitored flows traversing the interface that may have contributed to the burstiness, based on flows with the largest measured max burst values. This detailed information provides an unprecedented level of visibility into network behavior, enabling network operators to quickly identify and remediate congestion hot-spots network-wide.
Key Takeaways
Sometimes, the whole is greater than the parts – that’s certainly the case with the advanced hardware capabilities of Cisco Nexus 9000 series switches, the standards-based streaming telemetry provided by NX-OS, and the cutting-edge microservices-based Day 2 Operations functions provided by the Nexus Dashboard Insights application. Together, these technologies greatly simplify the process of identifying congestion in the network before it becomes a significant problem, making network operations teams more productive and more effective than ever before!
Resources:
- https://www.cisco.com/go/nexus9000
- https://developer.cisco.com/docs/nx-os/#!telemetry
- https://www.cisco.com/go/nexusdashboard
- https://www.cisco.com/go/nexusinsights

Tim, Good blog. This visibility may also help detect network anomalies and security threats in addition to QoS.
Is this hardware bases telemetry? As of now you cannot run software based and hardware based telemetry at the same time.