New Cisco Threat Grid dashboard yields faster malware analysis and response
Black Hat Europe kicked off just after the X Factor series finale was recorded live at the London ExCel Center, briefly mixing the Network Operations Centre (NOC) and Security Operations Centre (SOC) staff with hordes of teenaged fans. A few team members confessed to knowing who won the next day. 🙂
The NOC team quickly deployed a secure wireless network for the conference, with Ruckus providing the access points; while the SOC team set up security to protect the network from attacks and provide deeper visibility; Palo Alto Networks on the firewalls and RSA NetWitness 11 on identity and network forensics. New in the NOC/SOC this conference was the recently released Threat Grid Dashboard and Sample Manager.

New Threat Grid Dashboard
The redesigned dashboard made the malware analysis and response in the SOC so much more efficient than past conferences. The dashboard displays aggregated analysis data through a metrics bar and multiple, user configurable interactive visualizations.
The dashboard can be one-click configured to view My Organization or My Samples by the last 24 hours, last 7 days and last 30 days. An Auto Refresh control pulls the latest data, which we enabled for the SOC, along with the last seven days to have visibility for the entire conference.
A really helpful addition in the SOC was the Recent Samples section, which showed animated thumbnails of running samples. We could see immediately when training classes were pulling down malicious files, like document files exploiting VBA.
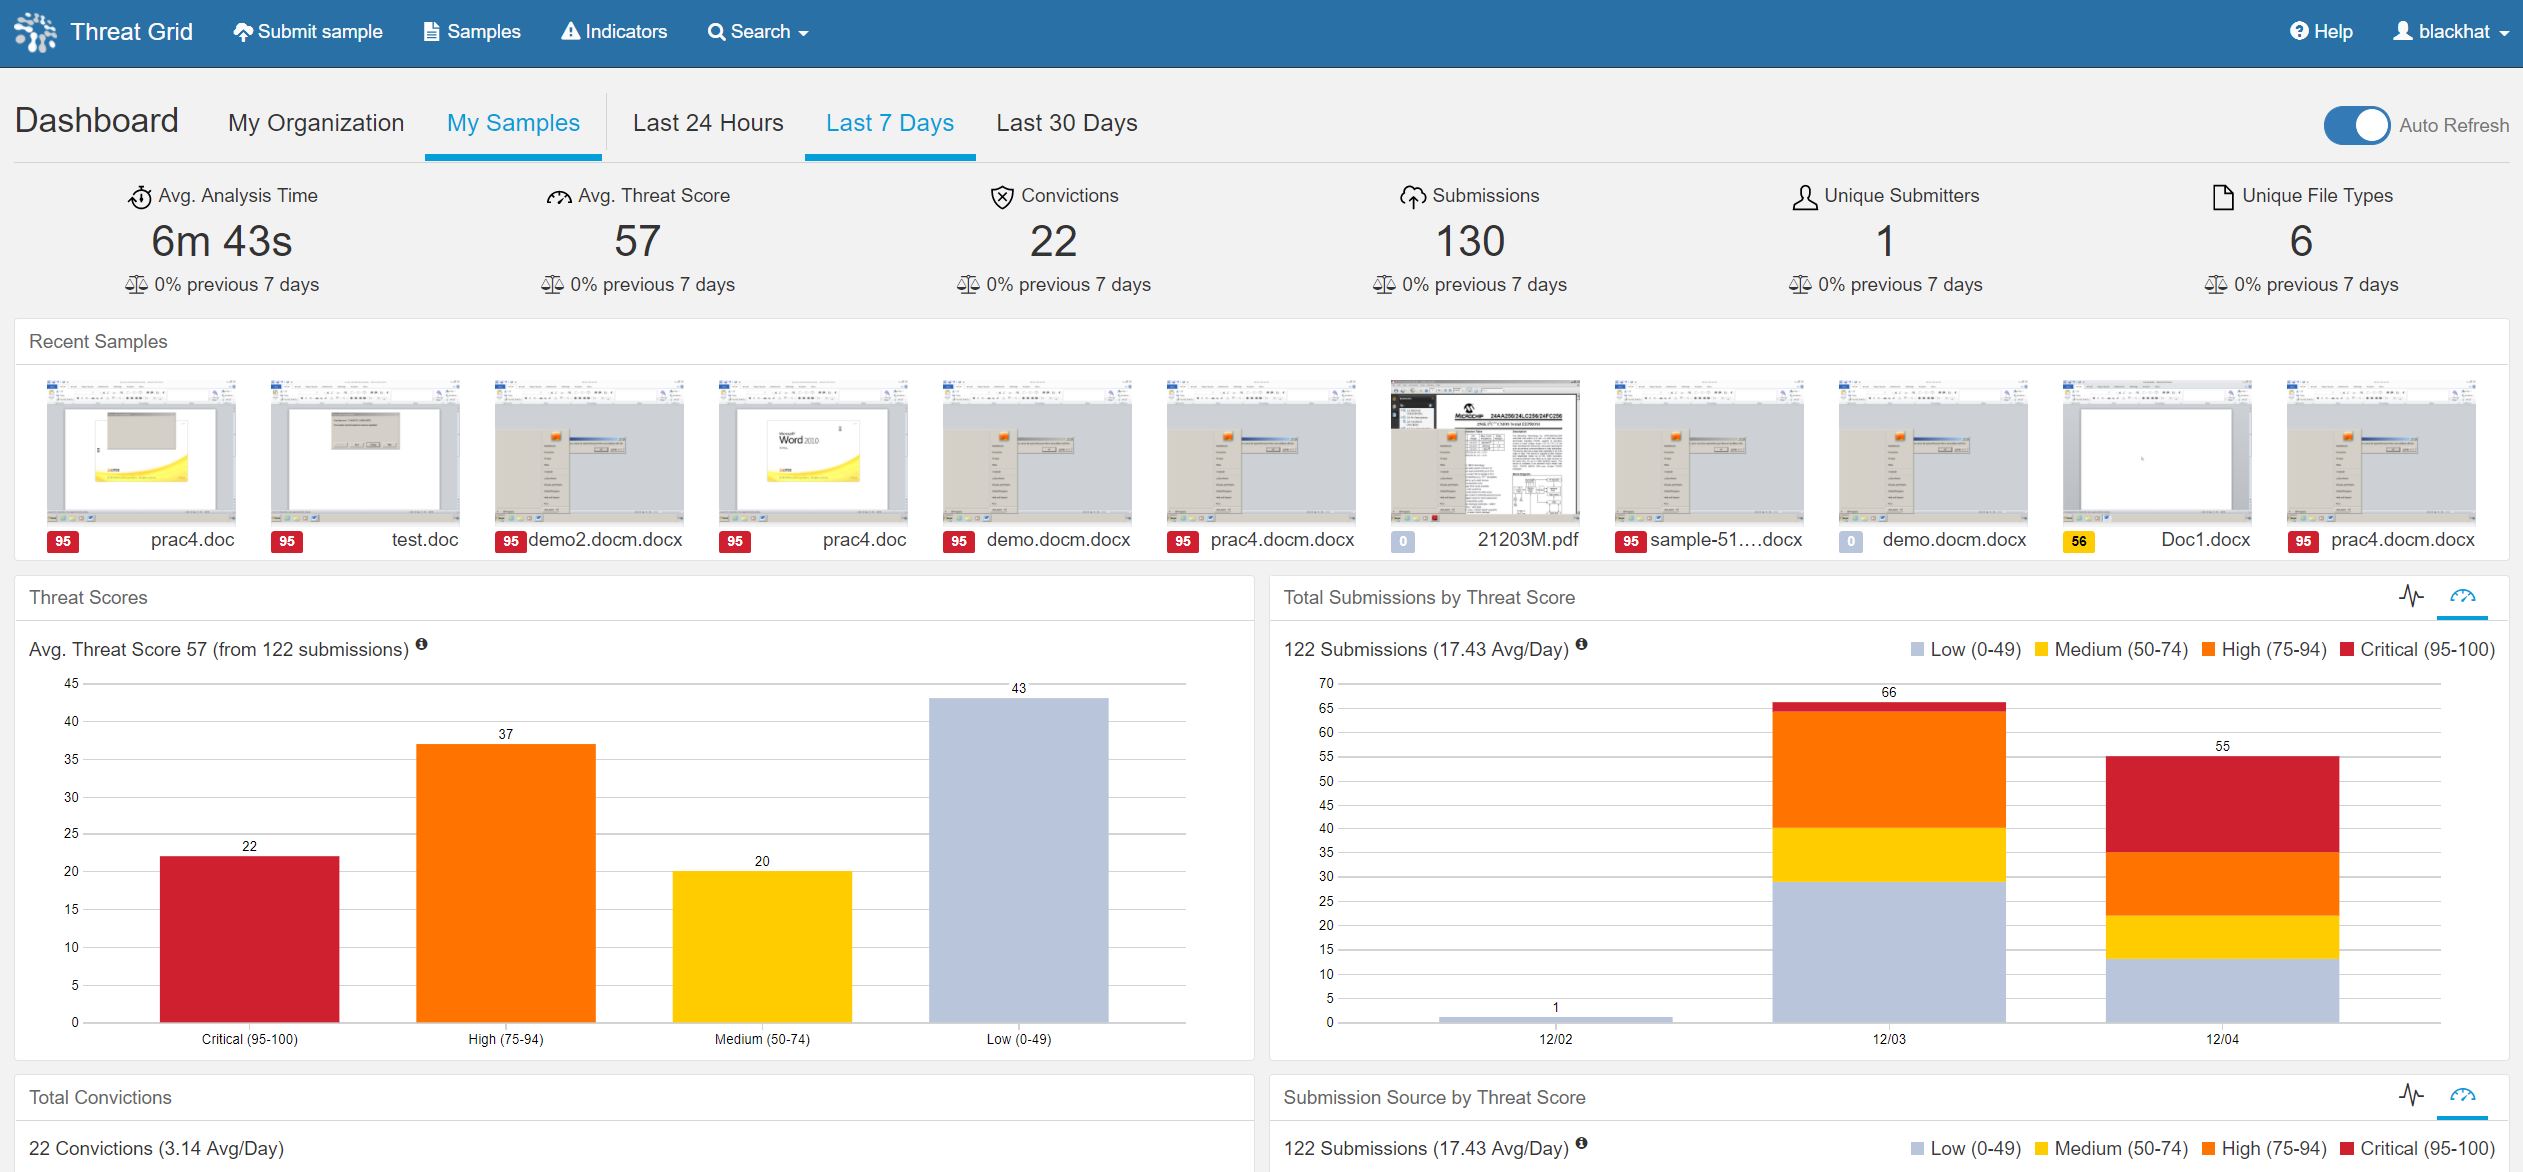
The thumbnail allowed us to see Word loading to launch the documents, as well as any pop-ups. Clicking on the thumbnail while the sample is running gave us accesses the unique Interact with Running Sample feature, also known as Glove Box.

Inside the Glove Box, we could interact with the sample, work with popups, browse to webpages, reboot the machine, etc.

When the sample is finished running, the analysis report will automatically display if you are still in the Glove Box. If you are still in the Dashboard, when the Threat Score displays beneath the thumbnail, clicking on it will open the analysis report instead of the Glove Box.

In this case, the document was flagged by our integrated anti-virus partners, raising the Threat Score to 90, High score, but not enough for a conviction for the purposes of automated remediation with the Integrated Threat Defense of the Cisco Advance Malware Protection security architecture. However, the Cisco Research and Efficacy Team built a machine learning model for when a single Behavioral Indicator does not reach the automated conviction level of 95+. It goes deeper and looks at combinations of Behavioral Indicators to make a malicious determination. This is called Specific Set Of Indicators Signaling High Likelihood of Maliciousness Detected, the result being a Threat Score over 95 and a conviction.

These samples came into Threat Grid through our integration with RSA NetWitness Packets, and I reported the cluster of files to my SOC team mates; so we could ensure it was a training exercise and not a danger to the network.
The mission of Cisco is to deliver Effective Cybersecurity that is Simple, Open and Automated. In my daily work at Cisco, my team and I execute on the Open and Automated mission pillars every day, building our ecosystem of technology partners with the Threat Grid RESTful API. Cisco has a Solution Partner Program, where member partners are able to create a Marketplace page with information on the integration and submit their solution for compatibility testing. Several partners have undergone the process of verification, with more joining the program every quarter.

The SOC team placed NetWitness Packets into Continuous Monitoring mode, where .exe, .dll, .pdf, .doc, .rtf and other potentially malicious payloads were carved out of the network stream and underwent Static analysis, Network intelligence and Community lookup; before sent to Threat Grid for dynamic malware analysis and additional static analysis. RSA customers can register for a no-cost Threat Grid account within NetWitness, for up to five samples per day for ad hoc analysis.
Were this a production environment, the hash value and conviction of the file would have automatically been recorded in the AMP Threat Intelligence Cloud, shared with all Cisco AMP security technologies. The result would be to quarantine the document on the endpoint, dropping the attachment on Email Security Appliance, blocking the download on Web Security Appliance and network packets containing the file would be dropped by Cisco ASA with FirePOWER Services and any lateral movement tracked by AMP for Networks. Any DNS queries and TCP/IP streams are also correlated with Cisco Umbrella with the integration of the Threat Grid threat intelligence feeds.

The contents of the document file remain private to the Black Hat organization, because by default all samples submitted to Threat Grid cloud via AMP products or RSA NetWitness Packets are marked as Private. The user can manually choose to share the sample with a simple toggle switch. You can also download the sample, the analysis report in HTMP or JSON, the full PCAP of network communication process timeline and watch the runtime video (both automated and/or manual interaction).

Back in the new Dashboard, several visualization widgets sped the analysis time in the SOC, including.
- Threat Score bar chart: Samples grouped by score and graphed by count over a configurable time period
- Total Submissions stacked bar chart: Samples grouped by submissions, graphed by count over a configurable time period, and stacked by status or threat score
- Total Convictions line chart showing conviction count (samples scoring 95-100) over a configurable time period
- Submission Source stacked bar chart: Samples grouped by submission source, graphed by count over a configurable time period, and stacked by status or threat score
- Submission Environments bar chart: Samples grouped by environment (VM on which they were run), graphed by count over a configurable time period, and capped by conviction count
- Submission File Types doughnut chart: Samples grouped by file type and graphed by count over a configurable time period
- API Sample Submissions gauge and line chart: Last 24 hours API-based sample submissions graphed via gauge; last 7 and last 30 days of API-based sample submissions graphed by count with vertical bar indicators calling out API submission limit reached
- Top Tags: Top tags correlated with the average threat score of all samples that are associated with the tag and displayed with the corresponding threat score color; visualized as either a bar chart with count or a tag cloud with count-based sizing
- Top IP Addresses: Top IPs correlated with the average threat score of all samples that referenced the IP address and displayed with the corresponding threat score color; visualized as either a bar chart with count or a tag cloud with count-based sizing
- Top Domains: Top domains correlated with the average threat score of all samples that referenced the domain and displayed with the corresponding threat score color; visualized as either a bar chart with count or a tag cloud with count-based sizing
- Top Indicators: Top behavioral indicators correlated with the average threat score of all samples that referenced the indicator and displayed with the corresponding threat score color; visualized as either a bar chart with count or a tag cloud with count-based sizing
The Threat Grid dashboard is backed by a new database, redesigned APIs and a streamlined, component-based front-end giving it huge performance gains. Dashboard settings (date range, auto refresh, tile view states, etc.) persist within and across sessions allowing the user to save their preferred view.

Clicking on the Critical bar under the Threat Scores opens the Sample Manager for the samples with scores 95+. The original Sample Analysis section was moved from the Dashboard into a dedicated page that offers a new interface to support rich filtering, Search, updated data, and much more.
In the SOC, we could see all of the Microsoft Office documents, with the VBA exploit.

The new Sample Manager improvements include:
- Sample filtering by Set (All, My Organization, My Samples), Date Range (including last 90 days and custom range), Threat Score, Submission Source, Status, and Access
- Search by keyword, Behavioral Indicator, Domain, IP, tag and more
- Sort based on Name, Type, Score, Date Submitted, and State
- A new SHA-256 column with one-click SHA-256 search and copy to clipboard
- A new Indicators column with stacked bar chart showing the sample’s behavioral indicators grouped by score and sized by score occurrence
- A new Actions column offering one-click access to the sample’s runtime video and a more actions button providing access to key functions like Mark Private, Download Analysis and more
- Sample Manager settings (filters, search terms, sort order, and items per page) persist within and across sessions allowing the user to save their preferred view
Cisco Umbrella
After joining the Black Hat NOC in Las Vegas last July, Cisco Umbrella was again used for DNS visibility and investigation. We added in the Network ranges provided by Gigamon for the conference, and DNS visibility began within an hour. We also enabled the Cisco Threat Grid intelligence feeds integration, by adding in the Black Hat’s Threat Grid API key.
This imported the ~15 curated feeds included in a Threat Grid premium subscription from DNS queries and network streams of malicious samples seen in the last day, including:
| · Autorun Registry Changes | · Ransomware Communications |
| · Banking Trojans | · Remote Access Trojans |
| · DGA Domains | · Stolen Certificates |
| · Documents with Network Connections | · Modified Windows Host Files |
| · Samples Downloading Executables | · Checking for Public IP Address |
By default, Umbrella will begin blocking DNS traffic to sites known to host Malware, to Command and Control Callback servers and Phishing Attacks. At Black Hat, we always want to enable all traffic, so the trainers and briefers can show the latest exploits, and we kept the settings from Black Hat USA.
Many presenters set up new domains and simulated malware expressly for the training. There were 5.8m DNS queries during the four days of the Conference. A little over 1,500 would have been blocked as Malware with known exploits, with many of the training destinations flagged as Potentially Harmful.

Security related DNS activity spiked in the afternoon of the first day.

We had a ransomware alert that would have been blocked, from the Threat Intelligence feed from Threat Grid.

Following the alert into Umbrella Investigate, we were able to understand greater context.

Scrolling down, we could see the associated Threat Grid samples and follow the link to a summary malware analysis report in Investigate, and the full Threat Grid report (with a subscription).

Another interesting attack vector was a malformed “wordpress” URL.
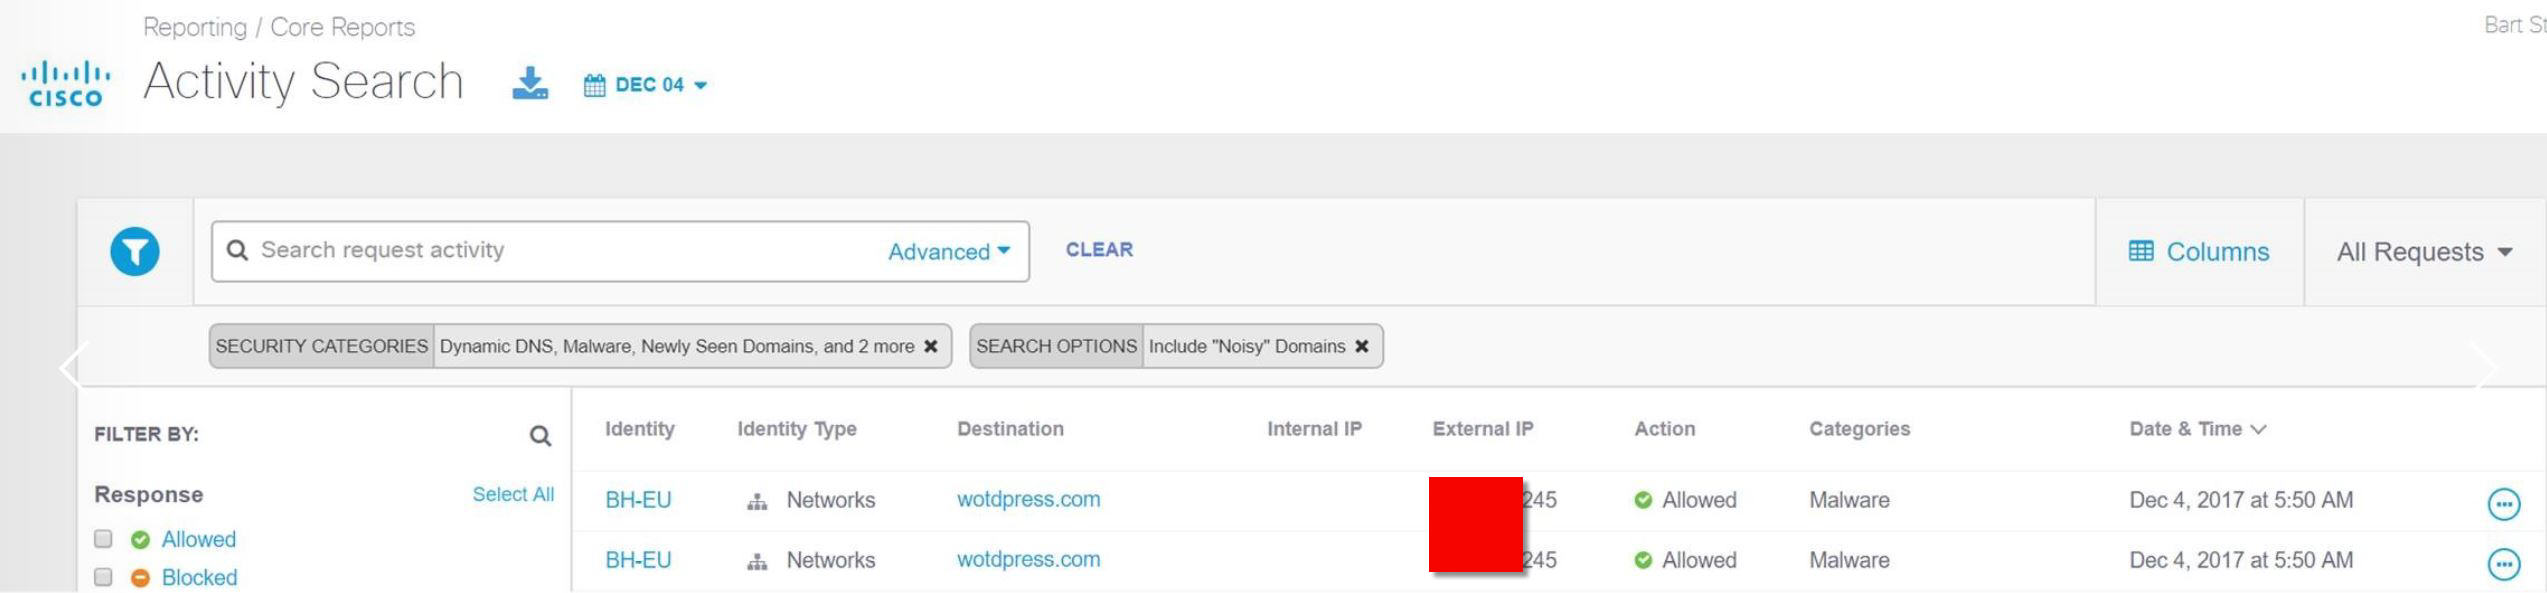
Had Umbrella enforcement been enabled, the malicious site would have been blocked. Pivoting into Investigate, we learn more about the domain.

Click on the IP Address, we can see the plethora of malicious domains hosted.

Top Domains that first afternoon, after search engines, were two training domains. The evilcorp.ninja was responsible for most of the Potentially Harmful alerts.

We also had SOC investigation into coinmine.com traffic at the conference. A joint investigation by the Palo Alto Firewall team, RSA Netwitness forensics team, and myself with Cisco Umbrella, determined the attendee machine was likely infected before the conference to mine bitcoin for an attacker.
At Black Hat USA, Malware quickly rose to one of the Top Categories, peaking at Number 3, before settling in at Number 7. For Black Hat Europe, Malware never broke the Top 10 Categories.

It was an amazing experience to be in Europe with the team and I’m looking forward to returning to Singapore in March, for Black Hat Asia 2018.


CONNECT WITH US