My two sons have very different tastes in many things like activities, clothes, brands, food, and, more than anything, condiments! At home, we have these endless battles on whether ketchup is better than mustard or mustard than ketchup. The message to my kids is that there’s no such thing as a universal better option. There are many reasons why one would choose one over the other: food sensitivities, ingredients, nutritional value, and taste to name a few. My older son likes everything sweet and he doesn’t care too much about sugar content so ketchup is the best option for him. My younger son doesn’t like to mix sweet and savory food and also is more mindful of the nutritional value. For this reason, mustard is best for my younger son.
All this to say that, at Cisco, we strongly believe in giving choices to customers so that everyone can have the solution that works best for them. And this is also true when it comes to managing your Cisco Catalyst infrastructure. One option would be Cisco DNA Center for which I’ve written numerous blogs. In this blog, we will discuss the characteristics of the recently introduced new option: Cloud Monitoring for Catalyst with Meraki Dashboard. The purpose of these blogs is to give you enough information to make the best choice for your environment.
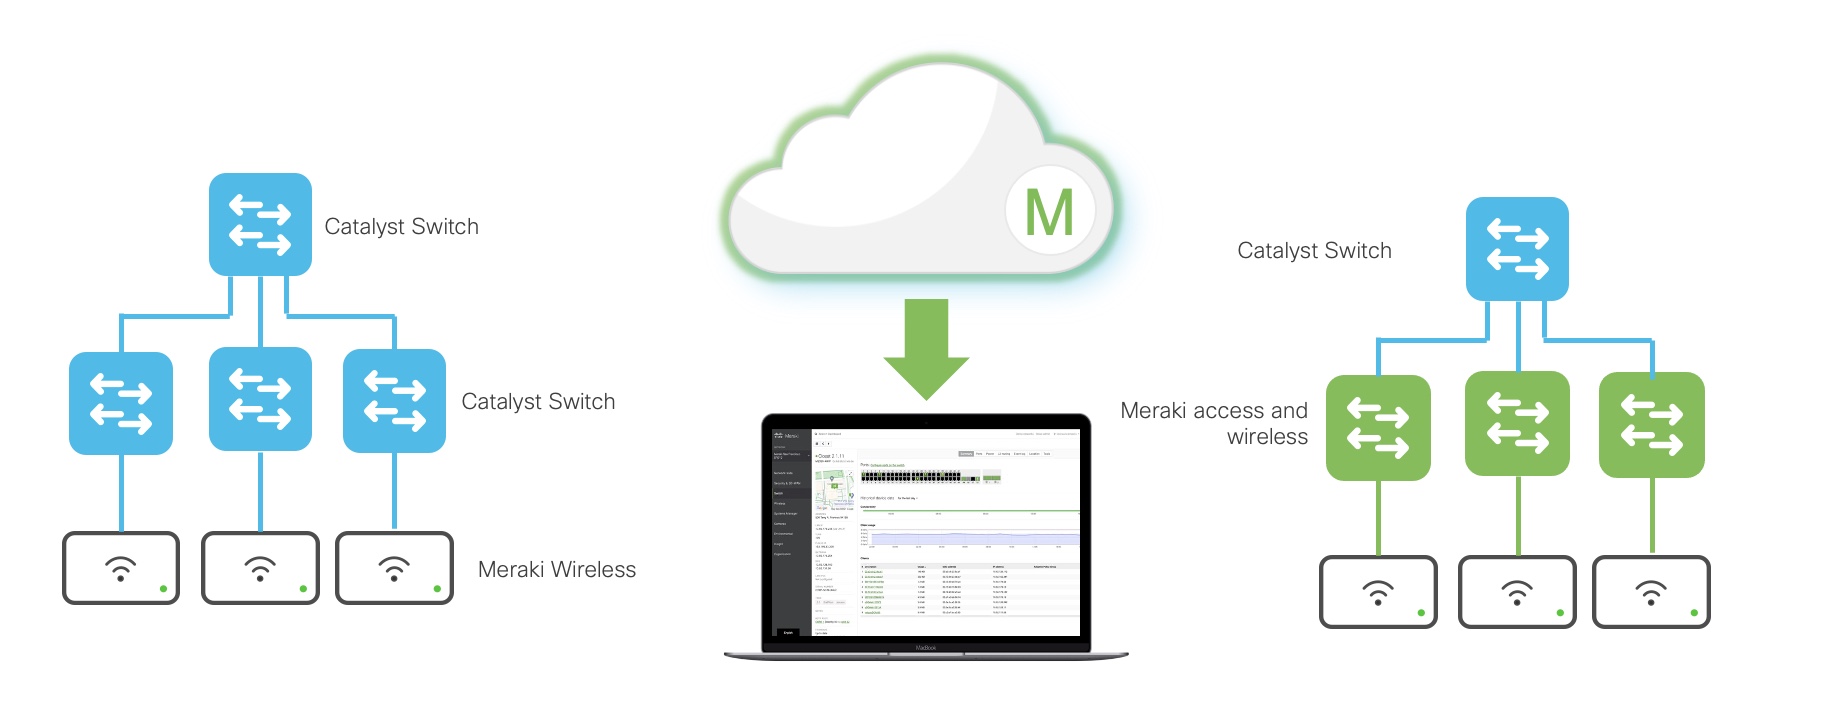
Meraki Dashboard can provide cloud-based monitoring for Catalyst devices and it’s a great option for numerous environments. For example, networks with Catalyst fixed configuration switches with no management platform or a legacy management platform that needs to be replaced. Another great use case would be mixed environments with Catalyst switches and Meraki infrastructure like we see in the picture below:
How do you know if Cloud Monitoring is right for your environment? In the next sections we will explore the following capabilities:
- Unified view of Cisco network infrastructure
- Device health and troubleshooting
- Network client and traffic information
Unified view of Cisco network infrastructure
Cisco Cloud Monitoring for Catalyst is especially interesting for environments with mixed Catalyst and Meraki devices because the Meraki dashboard can provide a unified view of the infrastructure including information like switch Up/Down status, model, version, serial number and firmware. Meraki dashboard also provides a topology view of the unified network:

Device health and troubleshooting
Meraki dashboard provides best-in-class cloud monitoring for Meraki devices and now to Catalyst devices as well. Network administrators can monitor Catalyst connectivity and health from the dashboard, obtain real-time switch and port health, port-level packet and error counters, and alerts for switch or port issues. Catalyst devices also benefit from live troubleshooting tools, like ping and port cycle, to help identify and correct problems remotely.

Network client and traffic information
Another very useful capability of the Meraki dashboard is that it provides visibility into the connected devices across the network and detailed network usage and traffic statistics. Meraki dashboard also provides application visibility including top users in the network and top application traffic over time.

What else do you need to know?
Besides the features and capabilities, there are a few other things you need to know to decide if this platform is the right operational choice for your environment.
- Platform: Meraki Cloud Dashboard – SaaS
- Capabilities: Monitoring Only (Meraki Dashboard will not configure the device)
- Supported Devices: Catalyst Switches 9200/L, 9300/L/X and 9500
- Switch OS: IOS-XE
- License: DNA Essentials or DNA Advantage
Cisco Catalyst switches mentioned in the list above can be on-boarded for cloud monitoring while retaining all features and capabilities available in IOS-XE. Having said that, the Meraki dashboard will only provide visibility on those features that are available in the Meraki Dashboard. For example, a Catalyst 9300 switch, can run a container with ThousandEyes Enterprise Agent. This switch can be monitored by the Meraki dashboard for all the capabilities mentioned in this blog. It can also retain the ThousandEyes Enterprise Agent installed. However, the Meraki dashboard will not provide monitoring capabilities on ThousandEyes Enterprise Agent deployed in the switch.
For Cloud Monitoring for Catalyst, the switches retain the IOS-XE operating system and the DNA license. There’s no requirement to convert the license to a Meraki license. The switches will leverage the DNA license and both “Essentials” and “Advantage” licenses are supported. The difference between both is that traffic analytics is only available with the “Advantage” license. All other features are available with both “Essentials” and “Advantage” licenses.

With this blog, I hope to have helped you decide your best choice for your operational platform for Catalyst infrastructure.
On that note, what’s your better choice: ketchup or mustard?
Want more information on cloud Monitoring for Catalyst?
Visit Cloud Monitoring for Catalyst Onboarding
Additional Resources
Campus & Branch Network Deployment Flexibility? We got you covered, Part 1
Witches and Switches: A New Era of Trick-or-Treating


Awesome Lila. Very concise and to the point.
Thanks so much Travis!
Great Blog. Thanks for details.
Thanks for the feedback, always appreciate it!
Great job on simplifying the capabilities of Catalyst Cloud Monitoring
Glad you liked it Bob. Thanks for leaving a comment!