San Jose State University deployed Cisco 1800S wireless sensors within Cisco DNA Center to measure and improve the user experience across their entire wireless network. See how Cisco’s wireless sensors helped improve onboarding, DHCP performance, DNS response time, and overall web site performance for their users.
As the networking director of San Jose State University–or rather, a small city of about 40K people where the wireless network is the most visible service–I have always struggled with the gap between what my network management tools tell me about the wireless network and what the actual user experience is.
For some time, I have argued that just because my network assurance solution shows all green, it doesn’t mean that zero users are having a dismal wireless experience. I have to ask myself, are the four service tickets we get a week on average representative of the wireless network issues as a whole or are they a proxy indicator? Let’s face it, some users don’t open helpdesk tickets, they just vent on social media. These have been my user experience pickles!
Measuring the user experience has been something I have been trying to get my hands around–for me it is the proverbial pot of gold at the end of the rainbow. Probably one of the reasons I have been so intrigued with wireless sensors is because they are not a synthetic client, they’re a “real” client with vast automation. My initial attempts at leveraging wireless sensors proved to be quite time consuming. For me, the 30 sensors required 4 to 6 hours of setup time before the actual testing could commence. Both sensors and test setup consuming the better part of a day really isn’t conducive to measuring the highly dynamic fluctuations of a wireless network.
Happily, things changed markedly for the better when we upgraded our sensors and our Cisco DNA Center to version 1.3.3. Our Cisco DNA Advantage for Wireless software subscription includes upgrades to the latest innovations and any new capabilities (like new sensor software and workflows) developed within the IBN (intent-based networking) framework and the assurance platform within DNA Center.
From Hours to Minutes
With the new workflows in Cisco DNA Center 1.3.3, those same 30 sensors are automatically discovered and easily onboarded in about 20 minutes. Once the sensors are onboarded, the complete wireless sensor test setup from beginning to end takes less than 10 minutes. Now we’re getting somewhere, and we can easily measure our user’s experience! Additionally, the sensors themselves are integrated into the issues dashboard for real time monitoring.

Wireless Network Assessment Using Sensor Tests
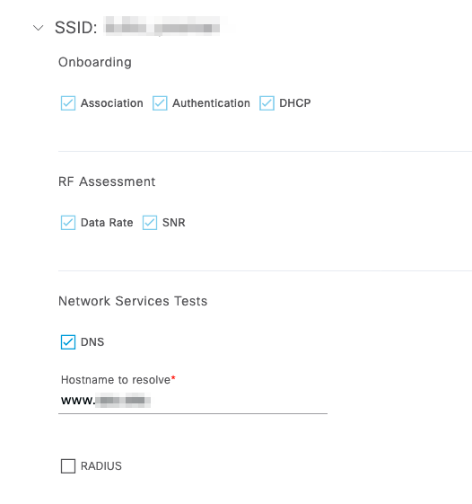
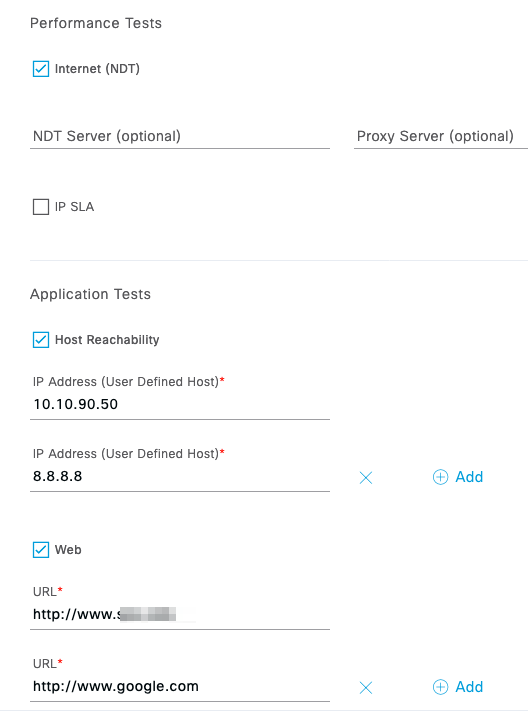
With the new software and workflow, we test and measure onboarding, DHCP performance, DNS response time and Web site performance. There are some additional tests which don’t apply to us such as FTP, radius, email, and more. Some of the test options we use are pictured below:
One particular capability that we rely on: Each sensor can now run a test against a preset number of access points in the “neighborhood”. Meaning a single sensor can target and validate multiple access points in the area assuming a minimal level of RSSI (we prefer -70dBm). This has helped us identify problematic APs in our network and zero in on wireless channel interference.
Consolidated Test Result Dashboard
So now for the smile moment: Inside the Cisco DNA Center Assurance under dashboards, the “Wireless Sensor” page paints the user experience picture very quickly. This dashboard provides summarized results and also contextual location results based on sites, buildings, or floors. As I had hoped, the speed tests were working consistently; this is an important measurement point as this is a common wireless complaint (slow wireless).

The dashboard also indirectly provides guidance on where not to place sensors (see the two red locations in the below screenshot). As you can see, we placed two sensors in locations that were convenient for us (in a data closet for easy POE access), but not optimal for wireless testing. Think about what you are trying to test and where to test it. The dashboard showed us that we needed to relocate those two sensors to areas closer to where our users congregate.

I would like to encourage readers who are planning on using the sensors to keep a subset of sensors to move around to monitor special events or install them in reported trouble areas. This is immensely important for high profile meetings where measuring after the fact is pointless. When moving or relocating the sensors, all you have to do is assign their new location in the Provision Devices section and the test suite will “automagically” start testing in that area.
Overall, I am very happy with the new workflow and capabilities of the sensor and how Cisco DNA Center has provided me with a true user experience measurement capability. I am planning on adding many more sensors–in classrooms, meeting spaces and study spaces on campus–to provide us with an even more holistic and granular view of our users’ experience (and get me even closer to that pot of gold!).
Discover more about Cisco DNA Analytics & Assurance


Contact E-ICE
I want to use for meeting
Thanks for sharing your experience, good to know the newer versions are working better!