Introduction: Splunk was an inaugural ACI partner and inaugural participant in the Cisco ACI App Center. Both at Cisco Live Berlin and at a recent Insieme organized Customer Advisory Board (CAB) meeting, I’ve seen customers evince keen interest in leveraging Splunk software in their Cisco ACI environments. It is no surprise to me that Cisco recently named Splunk as a Global ISV Partner of the Year … for the second year in a row.
ACI App for Splunk Enterprise Key value-props: Deploying Splunk in a Cisco ACI environment enables centralized monitoring, root cause analysis, compliance/audit and risk analysis, and distributed cross-tier visibility. With these capabilities, our customers can gain insights into ACI health. Our joint customers also get operational analytics via the customizable dashboards of Cisco ACI App for Splunk Enterprise. Our App collects various metrics that can be used for meeting SLA compliance and audits. The Splunk platform enables users to correlate data between multiple technology tiers for cross-tier visibility, which reduces the number of monitoring tools and shortens time to value.
Many ACI customers have been excited to learn about the robust, free and fully customizable Cisco ACI App for Splunk Enterprise. I will take you on a quick tour of recent innovations on the Cisco ACI App for Splunk, key use cases, and how the combination of Splunk and Cisco ACI addressed data center operations related painpoints.
The Cisco ACI App for Splunk uses Cisco’s open API framework to collect APIC events, health scores and inventory data into the Splunk platform. Using this data, the Splunk platform delivers centralized, real-time visibility for applications and ACI infrastructures across bare metal and virtualized environments. Ultimately, the Cisco ACI App for Splunk offers offers a flexible approach to monitoring Cisco ACI and all other elements of your technology stack.
How does the ACI App work with Splunk Enterprise?
- The Add-on is the back-end of the app.
- Scripts are run at regular intervals to fetch and index data into Splunk
- REST api request are sent to the APIC securely (via SSL)
- APIC responds with the data in JSON format and Splunk indexes the incoming data with correct metadata
- The App references the indexer and populates the dashboards
The Cisco ACI App for Splunk collects faults, performance and inventory data. Syslog messages are pushed from APIC controller to Splunk Indexers. Syslog messages include user information such as authentication logins and changes made to the environment for audit purposes. Performance metrics and inventory data are sent through API calls executed against APIC API.
New Innovations in the ACI App

Now, let us look at the new innovations that have been added recently to the Cisco ACI App for Splunk to cover advanced use-cases. These features work with Splunk version 6.3 and above and APIC version 1.3/2.0/2.1 respectively.
- Multi-pod for distributed fabric visibility
- Micro segmentation for risk analysis
- Enhanced user interface (system faults view, home dashboard)
- App Center Integration
Multi-pod for distributed fabric visibility: This feature enables an overview of the complete fabric segmented by multiple Pods and drilldown to a specific Pod to gain health and statistical information. Data center administrators can gain segmented visibility across interconnected separate ACI fabrics, known as Pods and utilize information in the Cisco ACI app for Splunk to gain knowledge about entities relating to various pods.

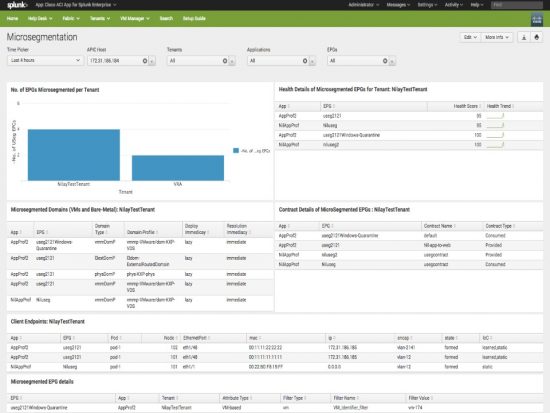
Micro segmentation for risk analysis: Monitor and get details of uEPGs and uEPGs that are quarantined or are restricted communication between end-points by applied filters. Micro-segmentation feature in the app allows users to view granular information on endpoints defined in a logical security zone, known as EPGs. Check on isolated endpoints, contracts associated between EPGs along with the health scores.
Correlate this information with established security policies to monitor east-west traffic within the data center.
Key dashboards features that cater to the use cases:
Enhanced user interface:
The easy to use, easy to understand user interface helps navigating and monitoring entities within the app with better time-to-value resolution for your use case. Dashboards are laid out in the form of single value entities, graphical representations and statistical tables. The user interacts with the app by using drilldown capabilities on the representations to gain further details.

App center integration: CiscoSplunkConnector App

Using the Cisco ACI App for Splunk enables customers to achieve operational efficiency through proactive real-time monitoring, analytics, compliance capabilities powered by the Splunk platform. Data Center admins get better visibility to enterprise-wide data and correlate with ACI infrastructure, with a single click app download.
Conclusion:
With the expansion of data center virtualization, insight into both virtual and physical network connectivity is critical for root-cause analysis of problems in virtual environments. Because Splunk Enterprise can harness machine data from any technology, it offers single-console visibility across multiple technology tiers, even bridging virtual and physical domains. As ACI and Splunk initiatives expand, customers can leverage cutting-edge innovations to address newer challenges in the area of operational analytics and incident management, and meet their compliance, audit and stringent security requirements.
To learn more, check out the below resources:
- Cisco ACI and Splunk Solution brief
- Cisco ACI App for Splunk Enterprise
- Cisco ACI App Center (blog post)
- Cisco Validated Design: Cisco ACI with Splunk Enterprise
Better yet, join us June 25-29 at Cisco Live Las Vegas where you can chose from more than 70 sessions about Cisco ACI and learn from Splunk and Cisco experts how we’ve partnered to deliver analytics-driven insights across Cisco’s industry-leading security, networking, wireless, data center and collaboration portfolios.


CONNECT WITH US