Cisco’s Connected Mobile Experiences (CMX) solution leverages information from the Wi-Fi network to collect aggregate location data from mobile devices. This can be used to tease out behavioral patterns and trends, which in turn can help businesses make informed decisions on how to improve the visitor experience and boost customer service.
The Mobility Services Engine (MSE) forms the core of the CMX solution. Cisco Live! Milan was an exciting milestone for the MSE development team, as the new version of MSE, 10.0, was officially announced. Among its enhancements are improved scalability and robustness, as well as better monitoring tools. In this blog, we’ll show some real-world examples of what information MSE 10 can provide, as was captured during Cisco Live!.
The New Analytics Dashboard
One of the visible improvements is the redesign of the Analytics dashboard. The dashboard provides reporting capabilities, in which each page can be scheduled at specified intervals to run as a report and be sent to interested parties. Because of this new capability, we now refer to the pages on dashboard as “Reports”.
Each report can have any number of “widgets” – essentially little boxes of information – such as the device count within a certain area, the time spent there, or the number of devices moving between areas. The widgets can be configured to show a set of numbers (ie number of devices detected, new devices vs. repeat visitors, etc.), a graph of specified information broken down by time/place, or data tables.
The most basic and fundamental piece of information CMX can provide is visitor count. In Figure 1 you can see the number of detected devices during one just one of the show days. The dashboard gives not only a very clear overview of detected devices, it also shows a comparison of those devices and where and when they’ve been detected throughout the conference.

Figure 1 Visitor count for one of the days
Beyond the fundamental data of total visitors, this information can be shown broken down by building, floor, or zone. Figure 2 shows the number of devices detected throughout the entire week, broken down by zone.

Figure 2 Visitor count shown by zone
Figure 3 shows the number of devices total at Cisco Live! These figures also show a neat new chart feature, thanks to the 10.0 release. The new chart feature allows for a more focused look at the data by providing a navigator bar which can zoom in on a specific range of interest. You’ll notice that Figure 3 is a zoomed in image of the most visited zones during Cisco Live!

Figure 3 Device count over time
Note: If you look closely, you’ll see a drastic drop in detected devices late Wednesday night and a pick-up on Thursday afternoon. The reason for this drop is simple: there is only so much testing you can do in the lab, and nothing beats an actual site, so with some of the development team on-site, we took advantage of the opportunity to run some experiments. The experiments were run with new code which provide better location accuracy. In order to try out the new code, it was necessary that we shut down the Analytics service during the Wednesday to Thursday gap. We were able to do this safely because MSE 10 was not the main MSE in use. The Friday night flat line was caused by a power failure, which was restored in the morning.
In Figure 4 you’ll see that the Analytics Dashboard, can also be used to show information regarding the dwell time of detected devices. Meaning time spent by people in various areas. This specific chart shows dwell times by floor.

Figure 4 Dwell times by floor
MSE 10.0 also includes some new charts. The Crossover feature shows what percentage of people visited a certain area also visited another specified area. Figure 5 shows this new chart in action. Data for Cisco Live! shows what percentage of the 8554 people that visited the “South Level 1” floor also visited another floor. South Level 1 was of special interest to us, as this was the main entrance to the entire convention. Information provided within the graph also indicates that “South Level 0”, the World Solutions area, was the most visited floor of the entire week. Having this information will prove invaluable to planning for our next convention.

Figure 5 The new crossover chart
Map Views
Besides charts and numbers, there are more ways to visualize where people congregate. MSE 10 can display the live locations of devices on a map. Figure 6 shows exactly this, a map dotted with location of all detected detected. At the time of this screen shot, sessions were ongoing in the orange, blue and red meeting rooms on the left-hand side, as can be seen from the large numbers of devices detected there.
Figure 6 Live view of device locations. Green dots are devices connected to the network; red ones are probing devices. Devices can also be coloured according to the SSID they are connected to, or their manufacturer. Furthermore, filters (such as SSID, RSSI threshold or MAC address) can be applied to narrow down the devices that are displayed,
We can also show this information as a heat map. Figure 7 shows two heat maps captured on a different floor which housed conference rooms. The difference between the spread of people during and between sessions can be clearly seen.
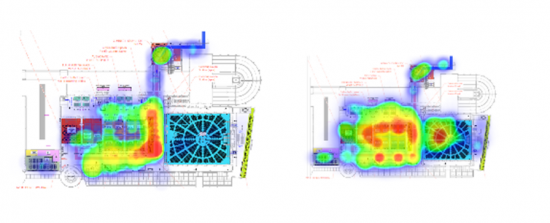
Figure 7 Heatmaps of the same area between (left) and during (right) sessions
System Monitoring
I want to finish off with some of the monitoring tools that are included with MSE 10.0. A large number of system metrics can now be inspected and visualized over lengthy and short periods of time. Figure 8 shows an example of this by charting CPU, memory, and disk utilization during the Cisco Live! week.

Figure 8 CPU, Memory and Disk Space consumption during the week
I was very pleased (and proud) of how seamlessly tracking happened while using MSE 10.0 within such a large space, with many devices, and look forward to implementing this powerful tool in many future opportunities. I can personally guarantee satisfaction, and encourage all Cisco employees and partners to try it out!
Please feel free to comment, share and connect with us on Facebook, Google+ and @Cisco_Mobility!


Nice summary of MSE 10 Analytics capabilities and interesting data snippets. Love the crossover chart. Wish the zone name was not snipped in the circle…Looking forward to more deployments!