This blog post was authored by Veronica Valeros and Lukas Machlica
Malicious actors are constantly evolving their techniques in order to evade detection. It is not only the sophistication or the rapid pace of change that is challenging us as defenders, but the scale of attacks. With the continuous flood of threats that we are facing, detection is just the first step. In order to keep our organizations healthy, prioritizing threats is key.

In our previous blog, Cognitive Threat Analytics: Turn Your Proxy Into Security Device, we showed how CTA detects breaches and malware that already bypassed the security perimeter of our organizations. Detecting the malicious traffic alone is not enough. Organizations need to understand the context in order to effectively prioritize and remediate those incidents. And when it comes to remediating security breaches, time is of the essence.
In this blog post we present how we improved CTA threat classification, now able to communicate the intent of every new finding by incorporating an extra layer of intelligence into the CTA detection chain [1]. CTA is now able to automatically classify and prioritize malicious traffic in specific threat categories from banking trojans, click-fraud and malware distribution to ad-injectors, money scams and malicious advertising campaigns. This blog explores how we are building a reliable training set in a big data environment, how we use it to train a new decision forest classifier and how we created a learning loop which led to a significant increase in the number of detections.
The cornerstone: building a reliable training set
CTA processes billions of HTTP & HTTPS requests every day. We extract feature vectors, and use them to build the training set for the classifiers. However, three major issues arise when working with this huge amount of data:
- Unbalanced ratio of malicious and benign requests: in network security the number of benign requests significantly surpasses the number of malicious requests.
- Computational costs: the computational horse power required for analyzing billions of requests becomes extremely expensive.
- Scarce labels: it is a fact that network data can not be fully labeled, only a small portion of requests can be labeled.
To deal with the first two issues, we need to reduce the amount of data in a way that the final dataset is more balanced and the computational costs are reduced. A dataset is considered balanced when it contains, in this context, a similar number of malicious and benign requests. To achieve this goal we take advantage of the Anomaly Detection Layer in CTA [1]. The Anomaly Detection Layer can be seen as a clever sampling tool capable of filtering out most of the ordinary traffic as illustrated in Figure 2. Using this component we are able to drastically reduce the input data and keep only a small percentage of the most interesting and important requests. This leads to a more balanced ratio of malicious and benign requests. The anomalous requests, are much likely to lie in the classification-relevant part of the feature space leading to well defined decision borders, which will be discussed later.

The third issue has a direct impact on the precision of the resulting classifier. Since network data cannot be fully labeled, we can only tell with certainty what is malicious and what is benign for a small portion of requests, which we call samples. How do we solve this? Typical methods use only labeled data for training. While these approaches can have good performance on the labeled dataset, the performance often does not hold when classifying the full unlabeled telemetry. This approach may result in weak decision boundaries as illustrated in Figure 3. In order to have a diverse background training set, we also include the unlabeled samples for the training. While this approach may lead to drops in the recall of the classifier, it results in stronger decision boundaries and significantly boosting the precision of detections.

As we mentioned above, we use all labeled data available and the full unlabeled data for training. Where do we get the set of labeled malicious samples? We use the Confirmed Threats provided by the third layer of CTA: the relationship modeling layer [1]. This layer correlates information across our global intelligence in order to find common attack patterns and malware behaviors in different organizations. Each confirmed threat is assigned a specific malware category and a risk score which are further leveraged for training data. We will get back to this in the learning loop.
Superforest, a special multi-class classifier
Decision forests are a set of numerous decision trees where the final decision of the forest is given by voting of individual trees in the entire group (see figure 4 for an example). To improve the robustness, precision and generalization performance of the classifier, we use the favored random forest implementation. As a binary classifier (malicious vs. legit) the random forests are already deployed in the CTA Event classification layer [1] for classification of general communication patterns such as DGA and other C&C behaviors.

The Superforest classifier is a special type of multi-class classifier. Three key characteristics distinguishes it from the previous ones:
- Different training strategy: instead of training multiple binary classifiers for each type of malware, we train only one model, i.e. the multi-class random forests.
- Size of training samples: while previous versions of classifiers were trained on hundreds of thousands of samples, for this we used tens of millions of samples to boost the performance of the classifier.
- Depth of the trees: the size of the training data set impacts the depth of the trees leading to significant increases in the number of nodes per tree from hundreds to tens of thousands.
As we mentioned in the beginning, detecting malicious incidents alone is no longer enough. The Superforest classifier is able to classify new incidents with a deeper level of detail, which is extremely valuable when it comes to prioritizing incidents, and using this information to remediate threats in an organization. Figure 5 exemplifies the benefits of such classifier.

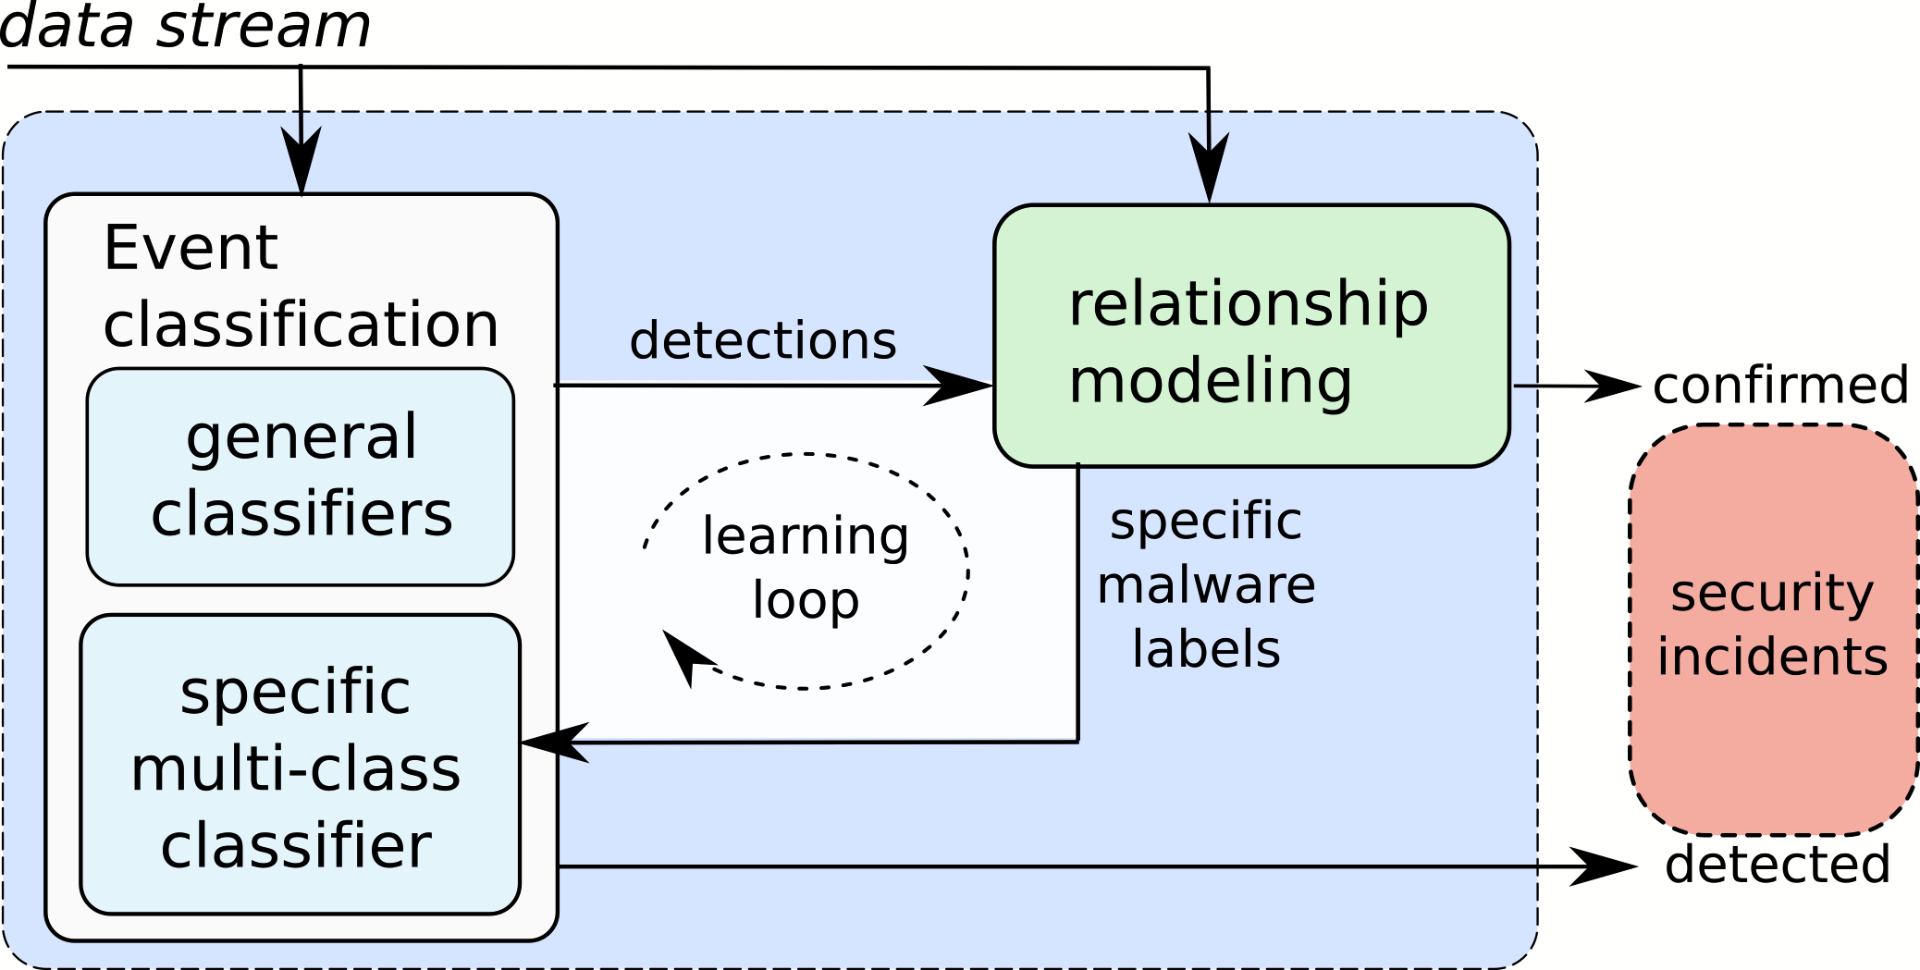
One step further: a learning loop
The learning loop is where all these pieces fit together. The Superforest and other classifiers, part of the CTA Event Classification Layer [1], produce novel detections. The next layer, Relationship Modeling [1], correlates this new findings increasing the number of Confirmed Threats. As we mentioned before, Confirmed Threats are used to train the classifiers. The increase on Confirmed Threats increases the available data for training causing an increase of the recall of the Superforest classifier each time it is retrained. The learning loop is depicted in Figure 6.
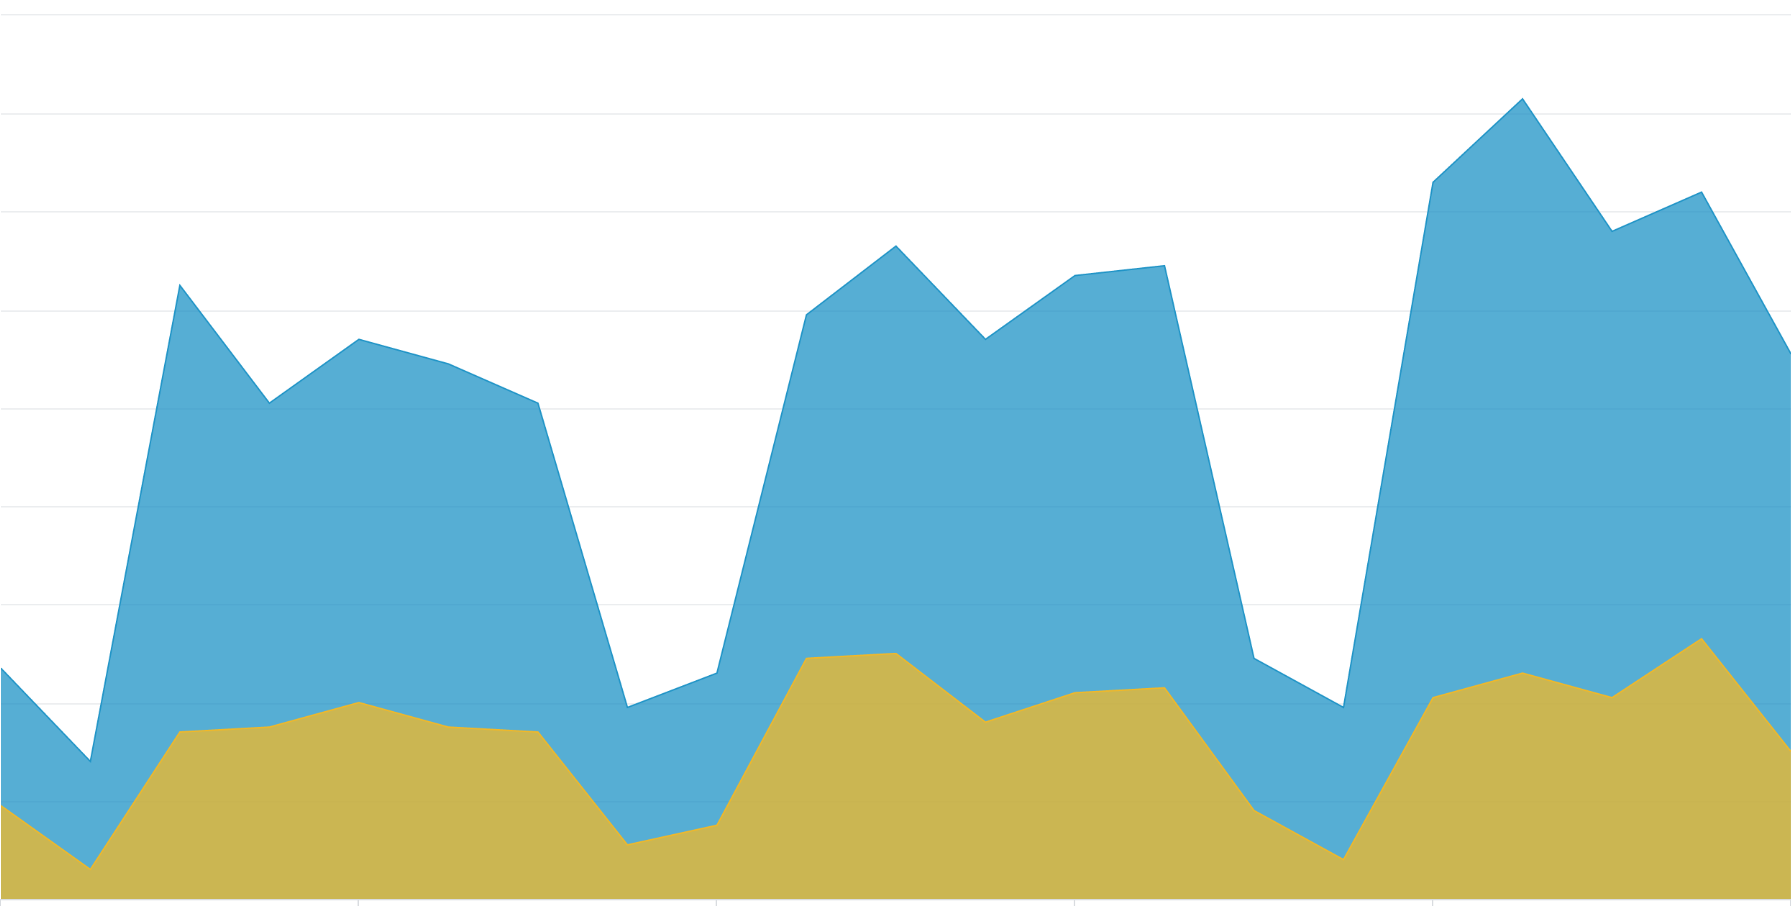
A boost in performance
In order to demonstrate the power of the enhanced CTA Event classification layer, we tracked the performance of the learning loop for 3 weeks. Precision of the classification was higher than 95% in all the cases. Figure 7 depicts a click fraud example where the yellow area shows the number of incidents per day given by the Relationship Modeling layer and the blue area represents the number of incidents per day as a result of the learning loop and the Superforest classifier.
Conclusion
The amount of threats organizations have to deal with present a challenge, for organizations and for security solutions. Identifying malicious traffic is table stakes and context is needed so organizations can prioritize the incidents, take action and reduce the potential damage caused by these threats. The Superforest multi-class classifier is leveraging both labeled and unlabeled data to classify incidents with a high level of detail. This approach is only possible by having a good set of training data, which implies solving three key issues: imbalance of data, computational costs and scarce labels. Cognitive Threat Analytics is able to go further, joining all pieces together in a learning loop which can improve itself over time boosting the performance of the detections.
Where to go next
To request a free evaluation that will uncover command and control communications lurking in your environment, visit: https://cognitive.cisco.com/
Read more about Cognitive Threat Analytics research:
- Cognitive Threat Analytics: Turn Your Proxy Into Security Device
- Piecing Together Malicious Behavior in Encrypted Traffic
Watch more about CTA as part of Cisco Security solutions:
- Cognitive Threat Analytics on Web Security – YouTube
- Cisco AMP for Endpoints Integration with Cognitive Threat Analytics Overview – YouTube
References
[1] Valeros, V., Somol, P., Rehák, M., Grill, M. (2016, September 19). Cognitive Threat Analytics: Turn Your Proxy Into Security Device. Retrieved from http://blogs.cisco.com/security/cognitive-threat-analytics-turn-your-proxy-into-security-device


Fantástico!