When a video quality issue happens, the network is the first to be blamed. Broadcast engineers struggle to identify the root cause and determine its impact. And the time from detection to resolution could be minutes or hours. It is no surprise that broadcast engineers spend more time on data collection than analysis. Troubleshooting is also costly and may prove impossible if the issue can’t be easily replicated in real-time. Proper Day 2 planning allows broadcast engineers to get ahead of challenges with the right tools needed for success: visibility, automation, security, and broadcast integration.
Fabric visibility through telemetry
IP fabric should not be a black box. Broadcasters need visibility to ensure that the content they send arrives intact. Without visibility, you don’t know if packets are dropped, where or why. Broadcasters need an easy to use, visual tool to see the flow in the fabric. Visibility is critical, must be real-time and consumable by 3rd party devices.
Telemetry is a tool that provides visibility. It can be divided into two categories, software, and hardware. Software-based telemetry offers an efficient way to obtain statistics being generated by the switch CPU, such as interface stats, Precision Time Protocol (PTP), and multicast tables. Hardware streaming telemetry provides the ability to stream hardware utilization such as buffer counters and IP packet headers. Cisco offers telemetry from both a hardware and software perspective. Nexus switches offer visibility across many statistics and telemetry can be consumed by third-party receivers as well as our media controller.
Extensive visibility reduces troubleshooting cycles and allows the broadcasting engineer to be proactive in solving problems before they happen. The Cisco Data Center Network Manager (DCNM) has a built-in telemetry receiver that receives real-time information from all switches in the fabric and provides an aggregated view. The DCNM media controller provides multicast flow visualization, flow health, bandwidth, and historical performance
 Figure 1: Multicast visualization and PTP monitoring
Let’s dig a little deeper into how software telemetry is used for multicast visualization. In SMPTE ST2110, packets are carried using multicast, so knowing how to troubleshoot multicast is critical for broadcast engineers. Multicast troubleshooting using switch Command Line Interfaces (CLIs) is challenging even for the most experienced administrators. Our DCNM media controller utilizes the telemetry information from switches to provide a Graphic User Interface (GUI) to visualize and trace multicast flows across the fabric in real time. These visual tools allow broadcast engineers to triage the problem by examining traffic flow and packet loss, which equals less down time. Figure 1 offers examples of visualization for multicast and PTP monitoring.
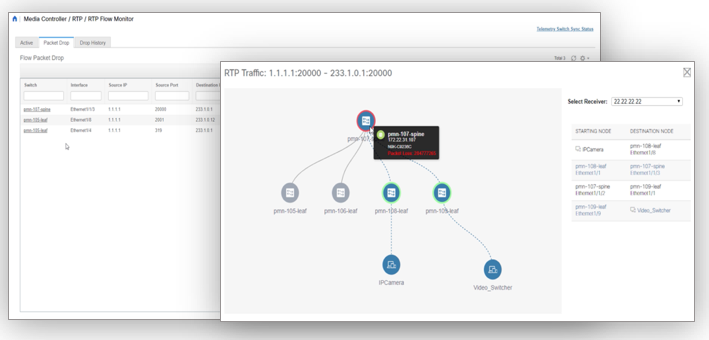
Figure 2: Visualization of Media Flow Insights
SMPTE ST2110 essence monitoring takes a step further into visibility. In current projects with broadcasters, I see wide use of media monitoring and analytic devices to report and monitor SMPTE ST2110 flow, PTP quality, etc. While these tools are excellent at what they do, they rely on the fabric to get them a copy of the flow in order to monitor. They are not reporting on the actual flow but on a copy of it. How can you improve decision making when you are not able to view the actual flow? And, what happens when many flows need to be monitored simultaneously?
Broadcast engineers must be able to visualize thousands of actual flows passing through the IP fabric. By monitoring and reporting on Real-Time Protocol (RTP) sequence gaps in an SMPTE ST2110 flow, the Cisco Nexus 9000 IP Fabric for Media can monitor multicast flow integrity at a scale of thousands of flows. This allows for real-time detection of per-flow packet loss with the granularity of 100 microseconds. The DCNM media controller can receive streaming statistics about RTP events from the fabric and present it in a graphical interface pinpointing errors in the fabric. Figure 2 shows graphics from the Media Flow insights tool. The media controller also tracks historical flow errors so operators can correlate network events retroactively.
Here’s a real-world workflow example: video traffic from a stadium is being sent back to a media data center for processing. The traffic passes through a service provider link which is not controlled by the broadcast engineer. With Media Flow insights, the broadcaster gets real-time reporting on the video flows prior to reaching the service provider network and also as the flow arrives at the media data center. The DCNM media controller correlates the reported state and localize if video errors were triggered at the stadium, at the SP transit network, or inside the media data center.
To summarize, operating an SMPTE ST2110 fabric requires visibility tools to give broadcast engineers critical insights to the “black box” called IP fabric.
Automate everything you can
Plugging and unplugging video cameras, microphones, and archive services should be as easy as moving an office telephone. But for broadcast engineers, it’s not. Every move has the potential for human error. Automation helps broadcasters onboard endpoints without interacting with the fabric. Cisco’s IP Fabric for Media solution components uses NXAPI (which are open standard RESTful APIs) to push policies and configurations to the switch. The switch streams provide information to DCNM using streaming telemetry. Telemetry configuration is achieved using the CLI or pushed from the DCNM to the switches in the fabric. The DCNM ships with media-specific templates which can be used to automatically generate and push telemetry configuration to all switches. Broadcast engineers can develop their own templates to fit the specific workflow.
Don’t forget security – It’s critical
Securing SMPTE ST2110 flows is critical to the workflow to protect the flow from unintended impact by other flows. New threats are affecting the media business so broadcasters need a comprehensive security strategy. When delivering and subscribing to content in the network, those flows require enhanced security and it should never be an afterthought
Security protocols protect the data flows and prevent outsiders from snooping around or stealing your content. To protect the bandwidth reserved for a flow, broadcast engineers should follow “trust but verify”. With this concept, flows are sent into the fabric but monitored to ensure a particular flow does not send more than its allocated bandwidth in order to protect all adjacent flows. Cisco’s Media Controller utilizes the host policy construct with whitelisting or blacklisting capabilities. The host policy defines who can send a particular flow (authorized sources) and who can receive it (authorized receivers). The policy is then dynamically applied to the fabric as the flows are enabled.

Figure 3: Integrated architecture
Integrating with the broadcast workflow
All of the above capabilities cannot be siloed. The fabric must be open and integrate with existing broadcast tools and controllers. Figure 3 shows how existing tools can be integrated into existing broadcast infrastructure, workflows, and tooling. The learning curve for broadcast engineers can be minimized using APIs and ecosystem testing and validation.
Don’t make Day 2 broadcast production transformation planning an afterthought. To learn more about the four pillars of success: visibility, automation, security, and broadcast, check out our webinar. You will learn methods and tools to troubleshoot fabrics carrying professional video flows in order to minimize anomaly detection and restoration time. Give us a call if you have any questions.


VERY useful information and advice
thank you for this